Power BI Sales app
APPLIES TO: Generally available in Business Central 2024 release wave 2.
The reports in the Power BI Sales app provide comprehensive sales analytics to stakeholders at all levels of your organization.
Executives and the leadership team can use the Sales Overview, Period-Over-Period Growth, and Month-To-Date reports to identify trends in sales performance.
Managers and team leaders can track individual sales team performance using the Sales by Salesperson report. They can also monitor overall team progress toward meeting sales goals by comparing actual results against targets in the Actual vs. Budget report.
Sales teams can use aggregated reports, such as the Sales by Item and Sales by Customer reports, to identify top-selling items and the customers that generate the most revenue. You can drill down from these aggregated views into transaction-level data for more detailed analyses.
You can use the reports in the Power BI Sales app for different things, depending on your role. This article provides some examples of use cases for different roles in your organization.
Sales analytics for the leadership team
The leadership team can use the app to gain a high-level overview of the organization's sales trends and financial health. The app helps leaders identify spending patterns, monitor budget adherence, and make strategic decisions to improve financial performance. It provides a clear picture of sales efficiency and highlights areas for potential cost reduction.
To fit this category, you might have a role such as:
- Executive
- Director
- Other high-level decision maker
Example scenario: preparing for an upcoming board meeting
Imagine you're the CEO of a company, and you're preparing for an upcoming board meeting. You need to present an analysis of your company's sales performance for the current fiscal year. To better understand the company's current position, you can use the Power BI Sales app.
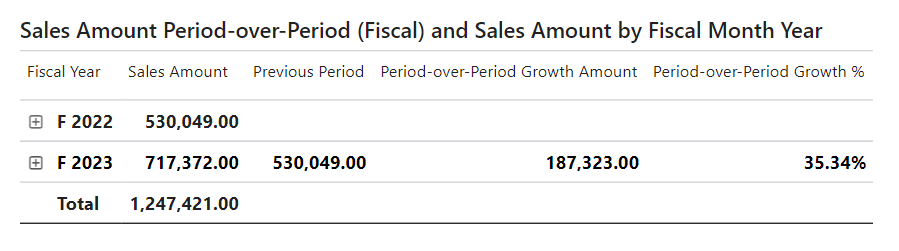
Start by reviewing the Period-Over-Period Growth report, which provides a quick, comparative view of the current year versus the previous year. Sales are up by 35%, outlined by the Sales Amount MATG % (Fiscal) metric shown in the following image.
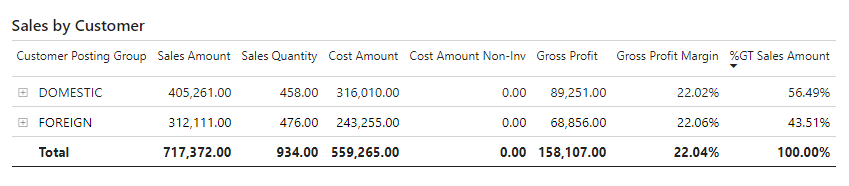
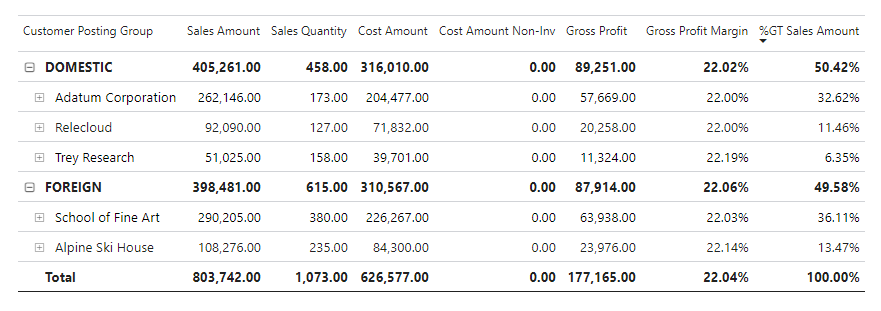
Next, you review the Sales by Customer report to identify which group of customers contributed most to sales. The Sales by Customer matrix shows that domestic customers outperformed foreign customers by contributing 56.59% to the total annual sales, as the following image shows.
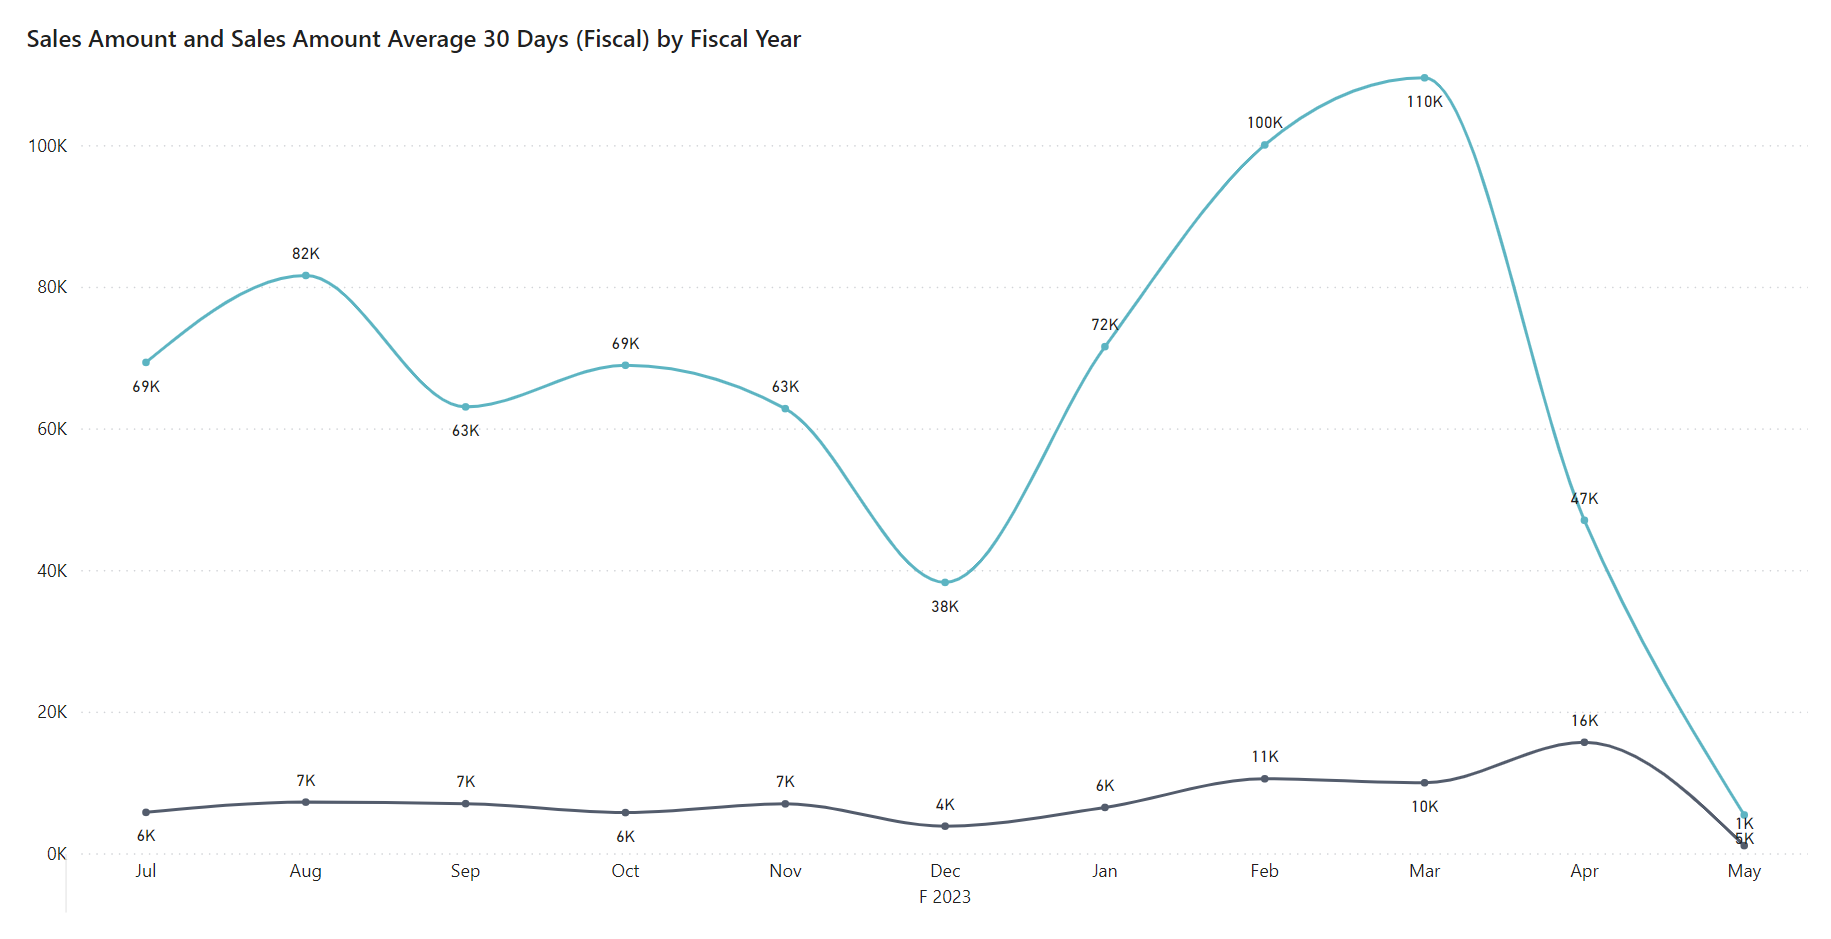
Finally, you review the Moving Averages report, which visualizes Sales Amount and Sales Amount Average 30D. The 30 day average smooths out the sales trend for the year and provides more good news for the company. On average, sales were stable through the first half of the year and then increased through the second half of the year.
The insights you gained from this report let you confidently present your organization's sales performance to the board, armed with data-driven analysis and a deeper understanding of your company's current position.
Sales analytics for the management team
The goal of the sales management team is to effectively oversee and manage sales processes.
To fit this category, your job title might be:
- Sales Manager
- Sales Team Leader
Example scenario: driving sales over the next two quarters
As a Sales Manager, you're tasked with driving sales over the next two quarters. You turn to the Power BI Sales app to understand the sales team's current standing.
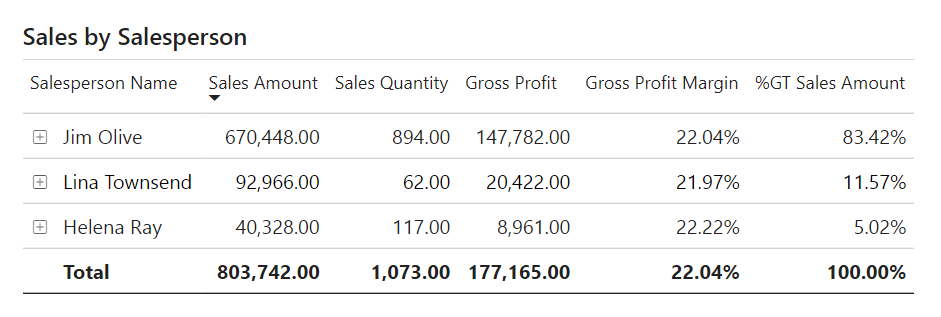
Start by reviewing the Sales by Salesperson report to evaluate individual team performance. You quickly identify Jim Olive as the top performer, generating 83% of the total sales for the year. You also see that Helena Ray was the most profitable salesperson on the team, but only by a small margin.
You know that clear targets help Lina and Helena reach their maximum potential. By establishing a new sales budget with revised targets for each salesperson, you can provide your team with the tools they need to progress. Using the Actual vs. Budget report, you monitor progress to ensure the team is on track to meet their new goals.
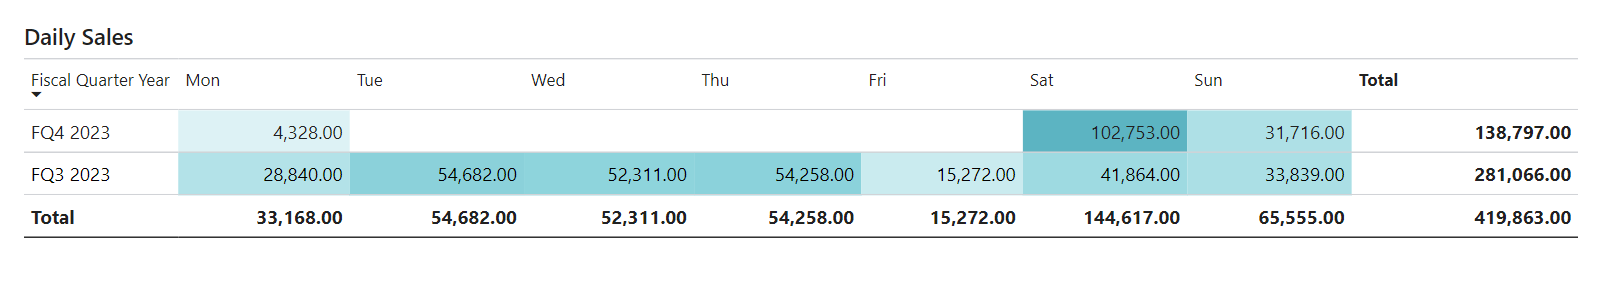
The Daily Sales report lets you monitor the team's progress over the next two quarters. You can use the heat map to gauge which day of the week the team performs best, and when the company should roll out marketing incentives to help drive customer engagement.
Sales analytics for daily sales work
People who work with sales on a daily basis often focus on handling day-to-day sales tasks with greater accuracy and efficiency.
To fit this category, you might have a job title such as:
- Account Manager
- Sales Person
Example scenario: using data to drive day-to-day sales
After the sales team receives the new sales targets from the sales manager, they're eager to improve their performance and meet the revised goals. To shape an effective strategy as a salesperson, you turn to the Power BI Sales app for insights into the company's sales patterns.
Start by analyzing the Sales by Item and Sales by Customer reports to identify high-potential products and key customers. These aggregated reports provide a clear view of where opportunities lie. That information helps you focus on the customers and items most likely to generate growth and help your team achieve their targets.
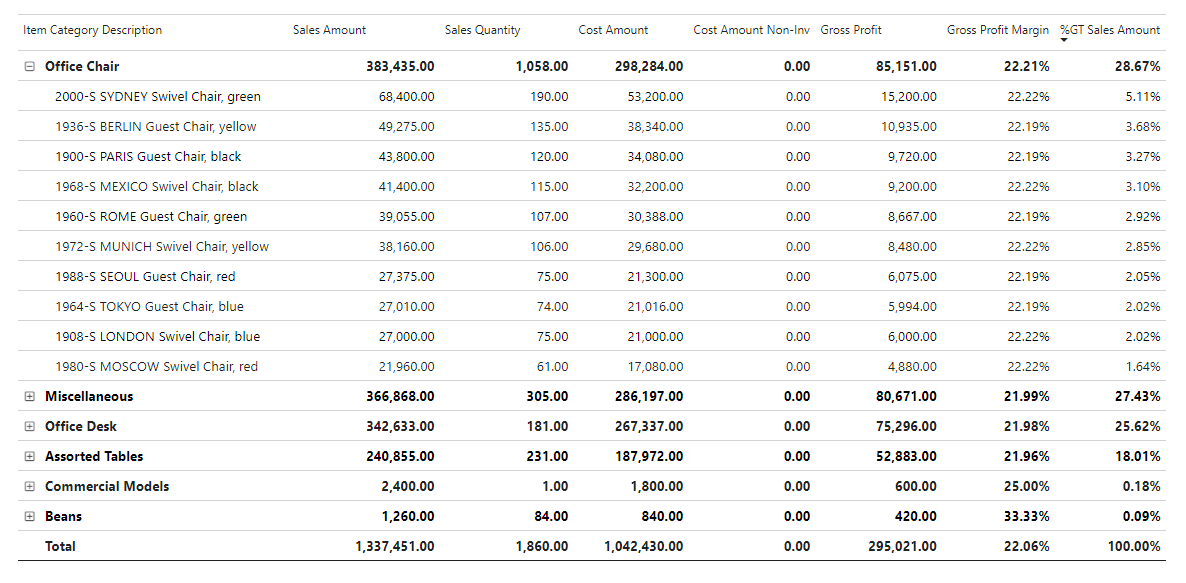
The Sales by Item report highlights product performance by clearly identifying which items generate the most revenue and, conversely, which items experienced a decline in sales. Targeting key products lets you and your team prioritize your efforts on highly profitable items and items with growing demand.
Report overview in the Power BI Sales app
The following table describes the reports in the Power BI Sales app and how you can use them.
| To... | Open in Business Central (CTRL+select) | Learn more |
|---|---|---|
| Analyze high level information on sales activities. Identify sales figures for quantity or amounts from both posted and unposted documents. | Sales Overview | About Sales Overview |
| Analyze sales by weekday over different periods. The heat maps highlight the days on which you sell the most, which helps you identify patterns in your sales. | Daily Sales | About Daily Sales |
| Analyze sales trends by smoothing out spikes and drops using the 30 Day Moving Averages report. | Moving Average | About Moving Average |
| Analyze the aggregated sales over a rolling 12-month period. Use this analysis as an alternative to a Year-to-Date report. | Moving Annual Total | About Moving Annual Total |
| Compare sales in one period with the same period in a prior year, quarter, or month. | Period-Over-Period Growth | About Period-Over-Period Growth |
| Analyze accumulating sales for a desired period. | Month-To-Date | About Month-To-Date |
| Analyze sales by item and view key sales metrics as a percentage of total sales. | Sales by Item | About Sales by Item |
| Analyze sales by customer and view key metrics. Metrics include sales amount, sales quantity, cost amount, gross profit, gross profit margin, and the sales amount as a percent of total sales. | Sales by Customer | About Sales by Customer |
| Analyze sales by salesperson and view key metrics. Metrics include sales amount, sales quantity, cost amount, gross profit, gross profit margin, and the sales amount as a percent of total sales. | Sales by Salesperson | About Sales by Salesperson |
| Analyze sales by location and view key metrics. Metrics include sales amount, sales quantity, cost amount, gross profit, gross profit margin, and the sales amount as a percent of total sales. | Sales by Location | About Sales by Location |
| Analyze item sales budgets against actual sales. View target variances for both sales amounts and sales quantity. | Actual vs. Budget | About Actual vs. Budget |
| Analyze sales opportunities and review key metrics. Metrics include estimated values, sales cycles and closed opportunity performance. | Opportunity Overview | About Opportunity Overview |
| Analyze high level information on sales quote activities. Identify sales figures related to sales amounts or quantity for prospective customers. | Sales Quote Overview | About Sales Quote Overview |
| Analyze high level information on return orders and view key metrics such as the sales amount, sales quantity, and return rate. | Return Order Overview | About Return Order Overview |
| Analyze sales performance across demographic segments, and get insights into customer behavior and preferences. | Sales Demographics | About Sales Demographics |
| Analyze sales figures to understand contributing factors, such as location names, item categories, and countries and regions. | Sales Decomposition | About Sales Decomposition |
| Analyze the key factors that drive sales performance. Find the most impactful variables and trends. | Key Sales Influencers | About Key Sales Influencers |
| Analyze sales by projects and view key metrics, including sales amount and sales quantity. | Sales by Projects | About Sales by Projects |
| Analyze the forecasted sales amount to gain projected sales insights across customer, salesperson and item. | Sales Forecasting | About Sales Forecasting |
Tip
Tip:
You can easily track the KPIs that the Power BI reports display against your business objectives. To learn more, go to Track your business KPIs with Power BI metrics.
Related information
Installing Power BI apps for Business Central
Track your business KPIs with Power BI metrics
Ad hoc analysis of sales data
Built-in sales reports
Sales analytics overview
Sales overview