Sales by Salesperson (Power BI Report)
APPLIES TO: Generally available in Business Central 2024 release wave 2.
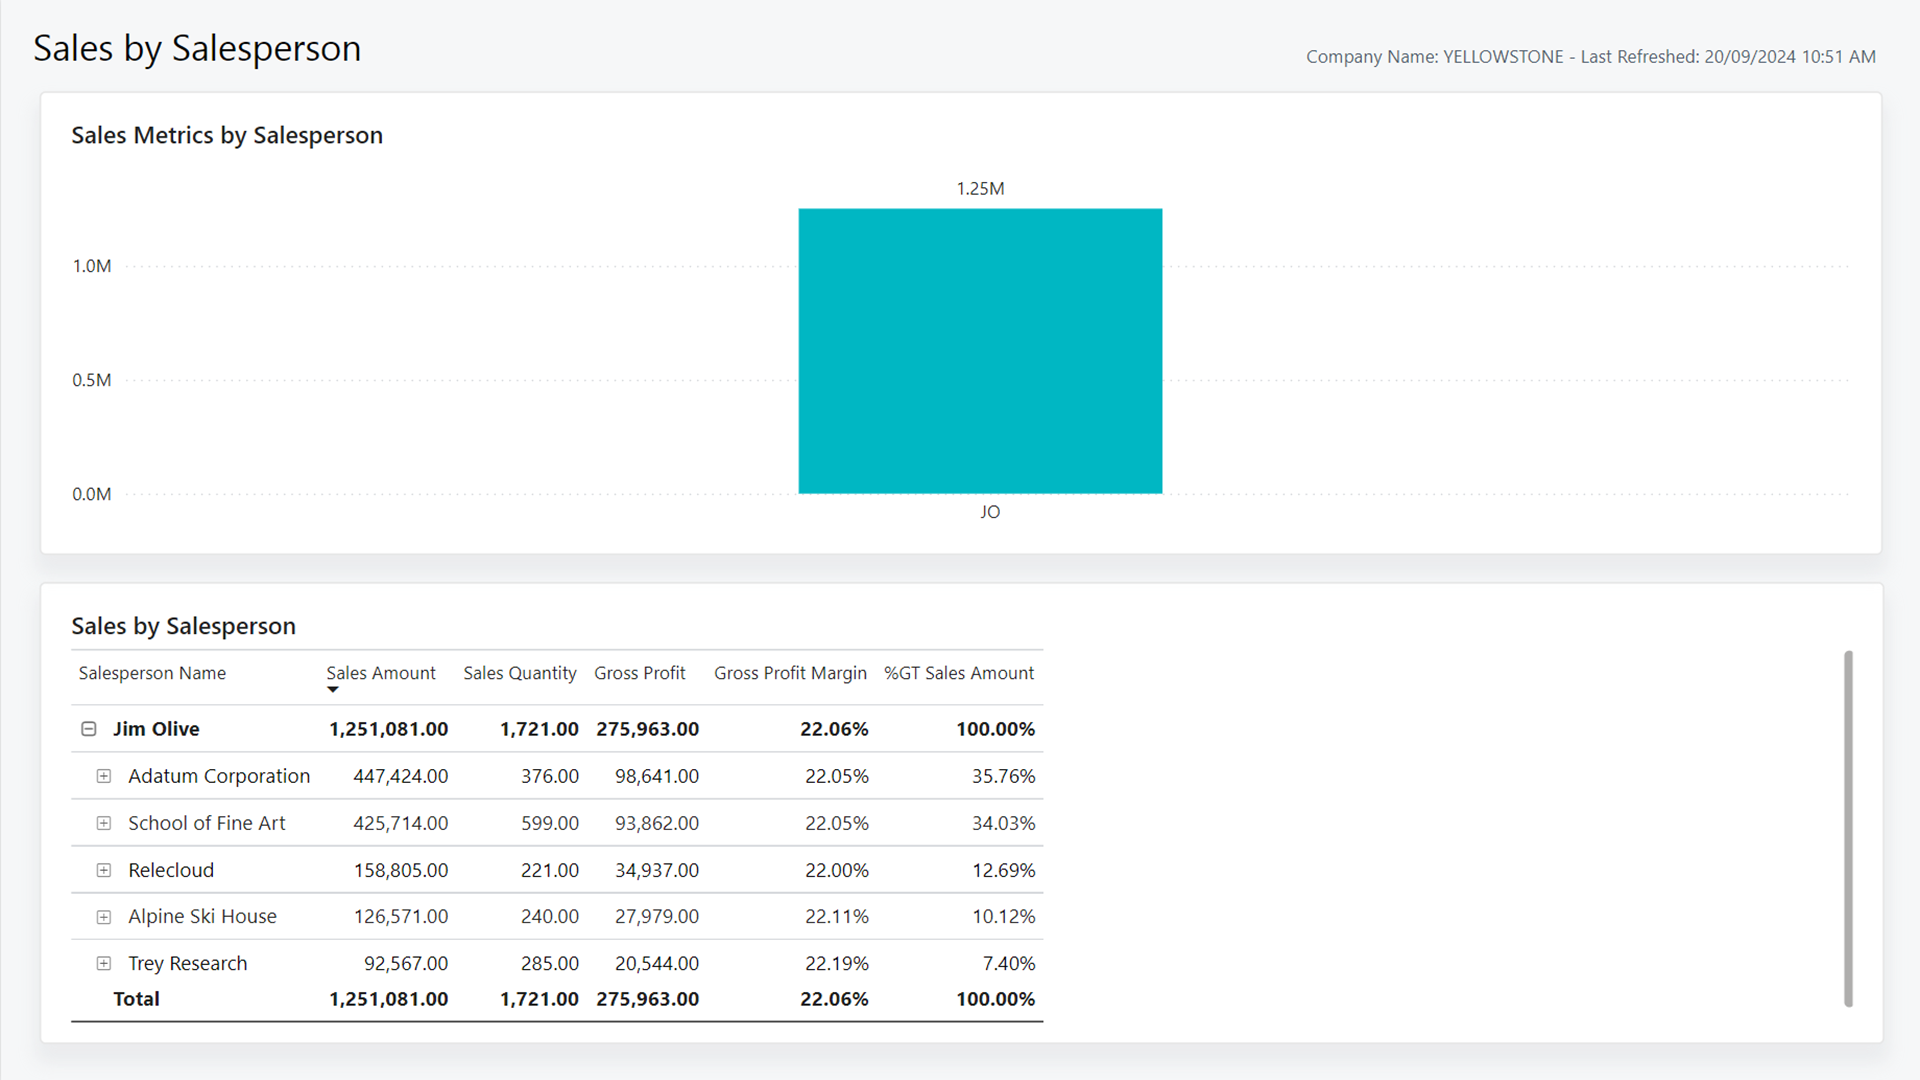
The Sales by Salesperson report provides an overview of sales performance for each salesperson. It showcases key metrics such as total sales amount and quantity. You can also view this information for each customer a salesperson sells to, and the items they sold.
Use the report
This report helps management and sales teams track the sales amounts that each salesperson generates and their contribution to the overall revenue.
Sales managers can use the report to monitor the sales performance of each salesperson and identify top-performers. For example, this information is helpful when you determine rewards. The report also helps identify under-performers who perhaps need support.
For example, you might notice that a particular salesperson's sales declined over the last few months. With this information, you can provide extra training or resources to help that salesperson achieve their sales targets.
Salespeople can use the report to monitor your own sales performance and identify areas for improvement. By analyzing the sales amount, quantity, and gross profit, you can easily identify which customers and items contribute the most to your sales. With this information, you can focus your efforts on the most profitable areas.
For example, if you notice that a particular customer contributes a significant amount to your sales numbers, you can focus on building a stronger relationship with that customer to increase their loyalty.
Key performance indicators
The report includes the following key performance indicators (KPIs) and measures:
Click on the link for a KPI to learn more about what it means, how it is calculated, and what data was used in the calculations.
Tip
Tip:
You can easily track the KPIs that the Power BI reports display against your business objectives. To learn more, go to Track your business KPIs with Power BI metrics.
Data used in the report
The report uses data from the following tables:
- Customer
- Salesperson/Purchaser
- Item
- G/L Account
- Resource
- Sales Value Entries
- Sales Invoice Lines
- Sales Credit Lines
- Project Ledger Entries
- Opportunity Entries
Try the report
Try the report here: Sales by Salesperson
Tip
Tip:
If you hold down the CTRL key while you select the report link, the report opens on a new browser tab. In this way, you can stay on the current page while you explore the report on the other browser tab.
Related information
Track your business KPIs with Power BI metrics
Ad hoc analysis of sales data
Built-in sales reports
Sales analytics overview
Sales overview