Sales Overview (Power BI Report)
APPLIES TO: Generally available in Business Central 2024 release wave 2.
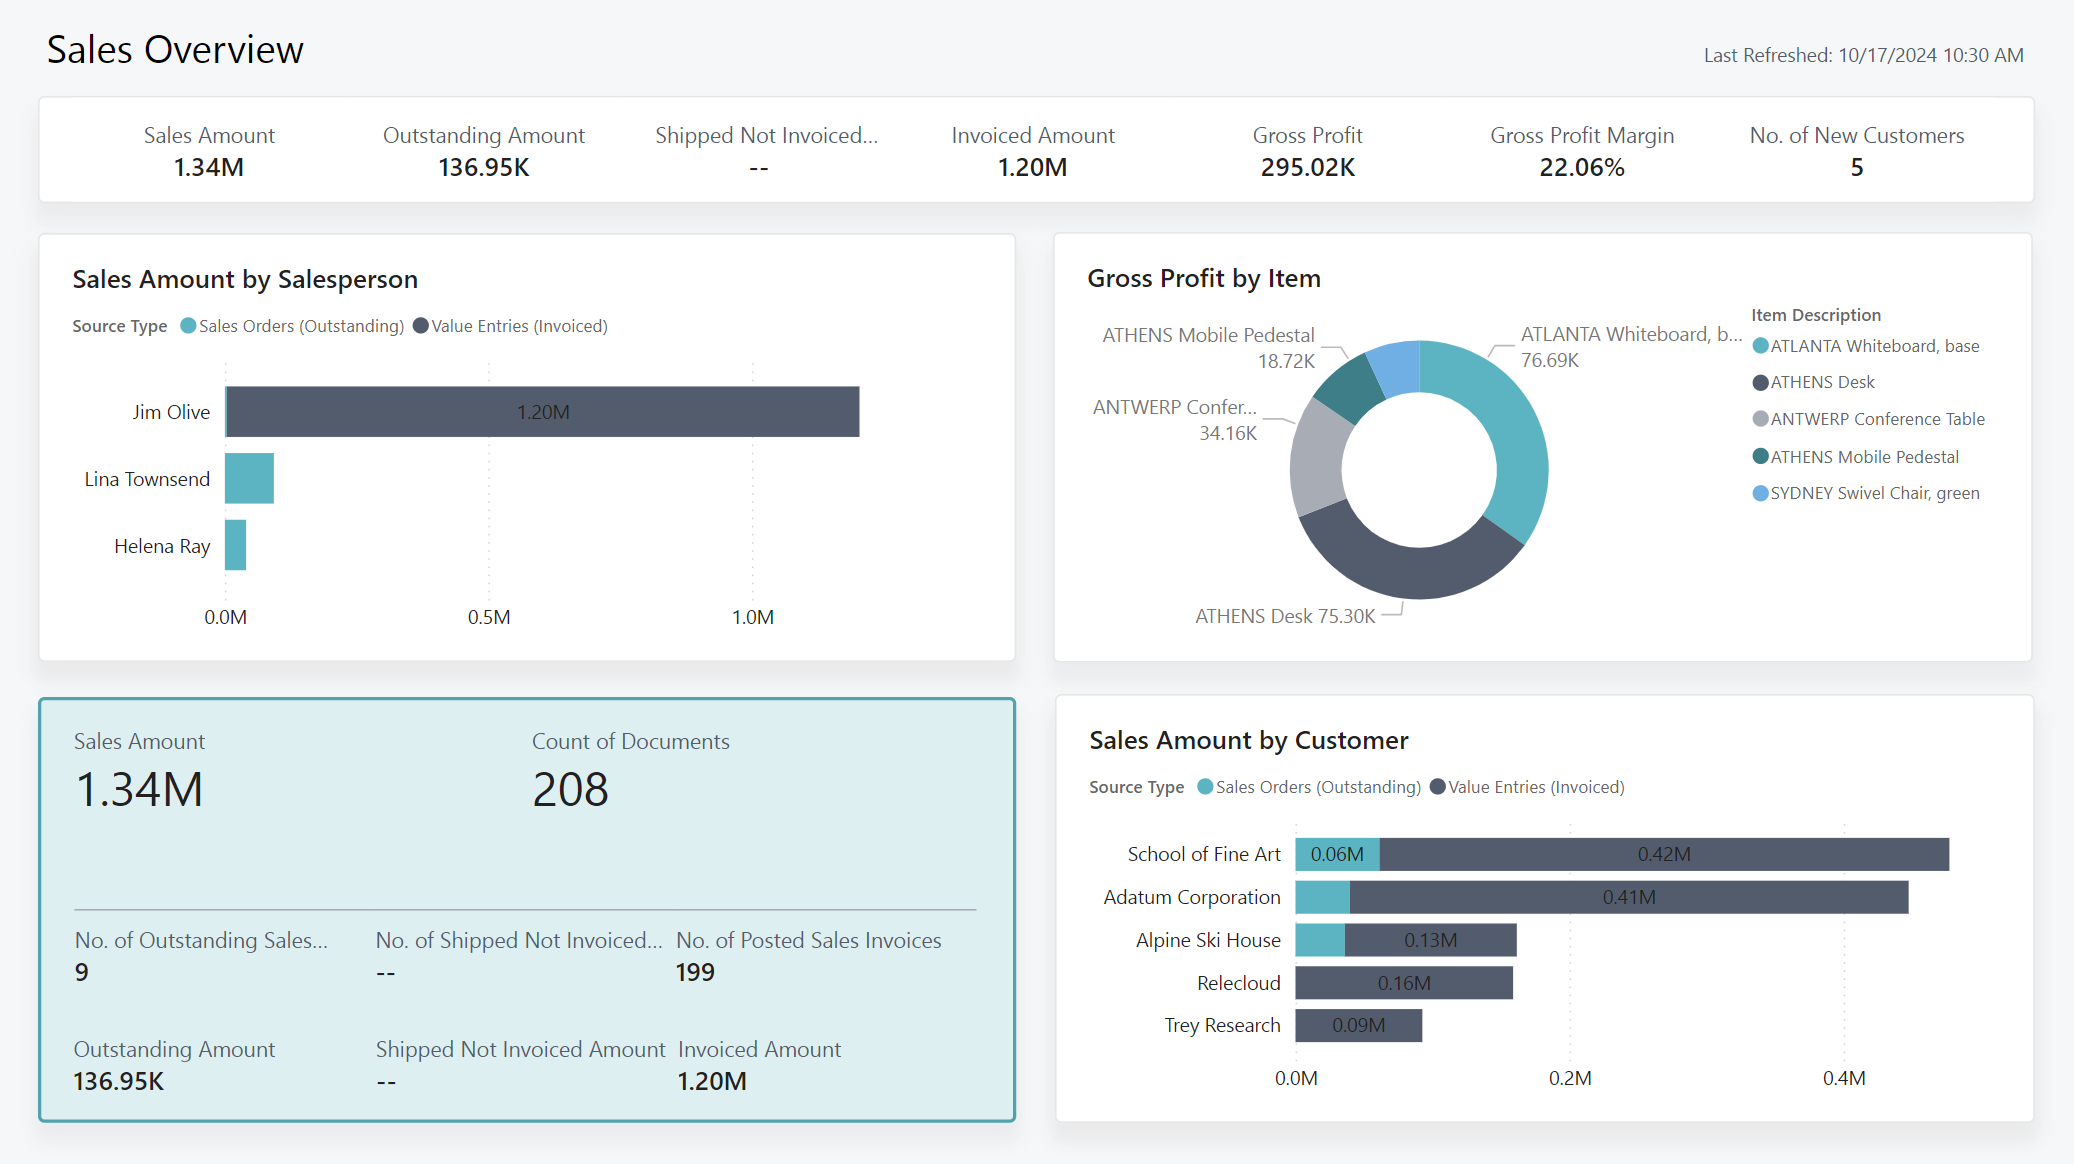
The Sales Overview report provides a high-level summary of your organization's sales activities. The report showcases key performance metrics (KPIs), such as:
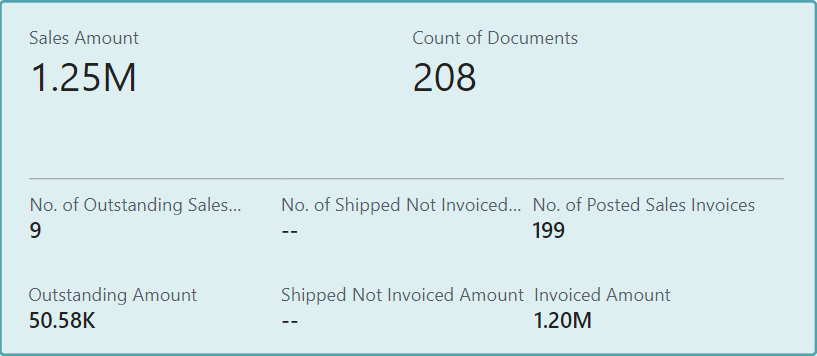
- The number of outstanding sales orders
- Shipped-but-not-invoiced orders
- Posted sales invoices
It shows the monetary values for each KPI.
This report also gives a quick view of sales amounts by salesperson, highlights the top five customers by sales amount, and shows the gross profit from the top five items.
Use the report
The report is intended for the following roles:
- Executives
- Directors
- Other high-level decision makers
CEOs regularly monitor the organization's sales operations to ensure the business is meeting its goals and operating efficiently. To get a quick, high-level overview, you turn to the Power BI Sales Overview Report to review:
- Number of Outstanding Sales Orders
- Number of Shipped Not Invoiced Sales Orders
- Number of Posted Sales Invoices
It shows the monetary values for each KPI.
Key performance indicators
The report includes the following KPIs and measures:
- Sales (LCY)
- Adjusted Cost (LCY)
- Adjusted Profit (LCY)
- Adjusted Profit Margin
- Outstanding Invoices (LCY)
- No. of Outstanding Sales Orders
- No. of Shipped Not Invoiced Orders
- Outstanding Orders (LCY)
- Shipped Not Invoiced (LCY)
- No. of Outstanding Invoices
Click on the link for a KPI to learn more about what it means, how it is calculated, and what data was used in the calculations.
Tip
Tip:
You can easily track the KPIs that the Power BI reports display against your business objectives. To learn more, go to Track your business KPIs with Power BI metrics.
Data used in the report
The report uses data from the following tables:
- Sales Line
- Value Entry
- Sales Invoice Lines
- Sales Credit Lines
- Project Ledger Entries
- Item
- Salesperson
- Customer
Try the report
Try the report here: Sales Overview
Tip
Tip:
If you hold down the CTRL key while you select the report link, the report opens on a new browser tab. In this way, you can stay on the current page while you explore the report on the other browser tab.
Related information
Track your business KPIs with Power BI metrics
Ad hoc analysis of sales data
Built-in sales reports
Sales analytics overview
Sales overview