Sales by Customer (Power BI Report)
APPLIES TO: Generally available in Business Central 2024 release wave 2.
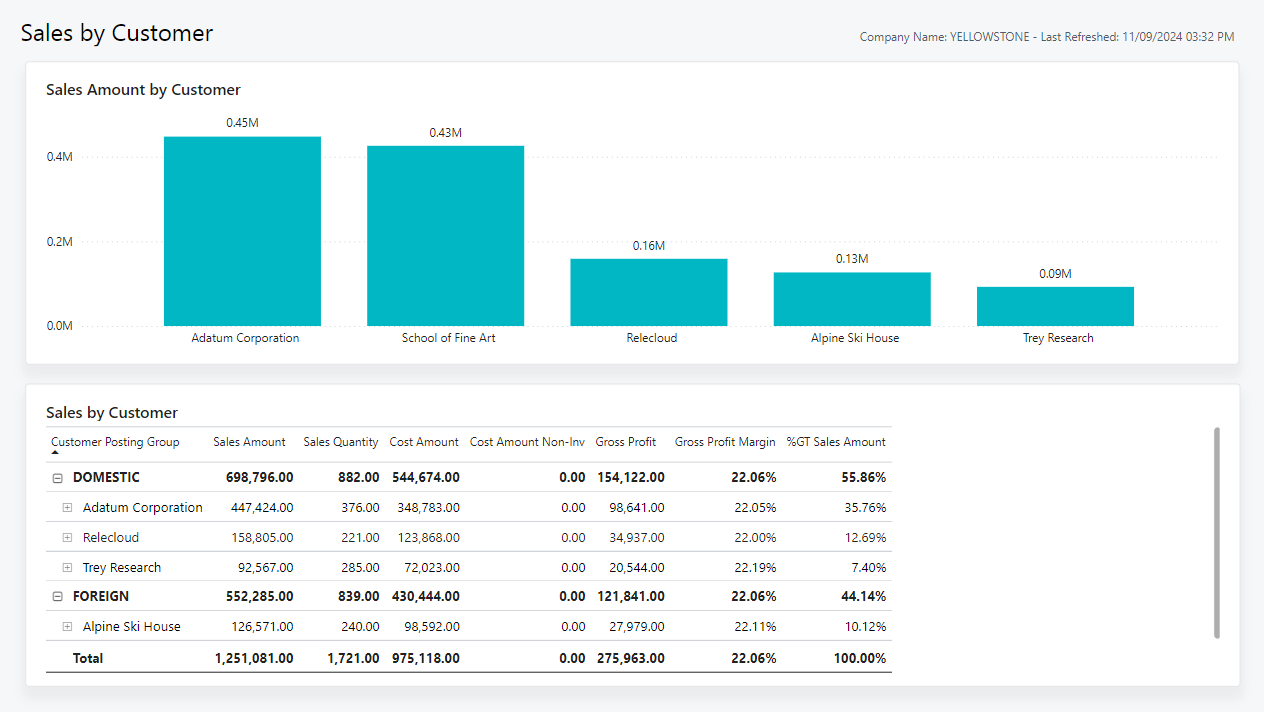
The Sales by Customer report gives a clear picture of your organization's customers and their sales activities. It highlights key metrics for each customer, such as sales amount and quantities along with the costs associated. You can break down the metrics by the specific items that are sold per customer to identify key trends.
Use the report
This report is meant for all users to identify key customers and other customers that buy less than expected.
A COO can quickly identify a list of the top customers generating revenue for the company. You can easily identify which customers are generating the most revenue and how much each customer is contributing to your company's overall revenue. This information helps you make informed decisions and can provide valuable insights to the CFO regarding where the revenue is coming from.
A business development manager can quickly identify how you're attracting new customers to purchase from your organization. You can break down the metrics to find out how salespeople are performing. This information can then translate into what a sales manager would want to see, and enable them to track how sales are going for different salespeople.
For salespeople, the report you help can tailor your onsite visits to your customers based on their recent purchases. This report can also show you insights into specific period trends for this customer, and identify opportunities to up-sell or cross-sell.
Key performance indicators
The report includes the following key performance indicators (KPIs) and measures:
- Sales (LCY)
- Adjusted Cost (LCY)
- Cost Amount Non-Inv
- Adjusted Profit (LCY)
- Adjusted Profit Margin
- Pareto Cumulative Adjusted Profit %
- Pareto Cutoff Adjusted Profit %
Click on the link for a KPI to learn more about what it means, how it is calculated, and what data was used in the calculations.
Tip
Tip:
You can easily track the KPIs that the Power BI reports display against your business objectives. To learn more, go to Track your business KPIs with Power BI metrics.
Data used in the report
The report uses data from the following tables:
- Customer
- Item
- G/L Account
- Resource
- Sales Value Entries
- Sales Invoice Lines
- Sales Credit Lines
- Project Ledger Entries
Try the report
Try the report here: Sales by Customer
Tip
Tip:
If you hold down the CTRL key while you select the report link, the report opens on a new browser tab. In this way, you can stay on the current page while you explore the report on the other browser tab.
Related information
Track your business KPIs with Power BI metrics
Ad hoc analysis of sales data
Built-in sales reports
Sales analytics overview
Sales overview