Sales by Item (Power BI Report)
APPLIES TO: Generally available in Business Central 2024 release wave 2.
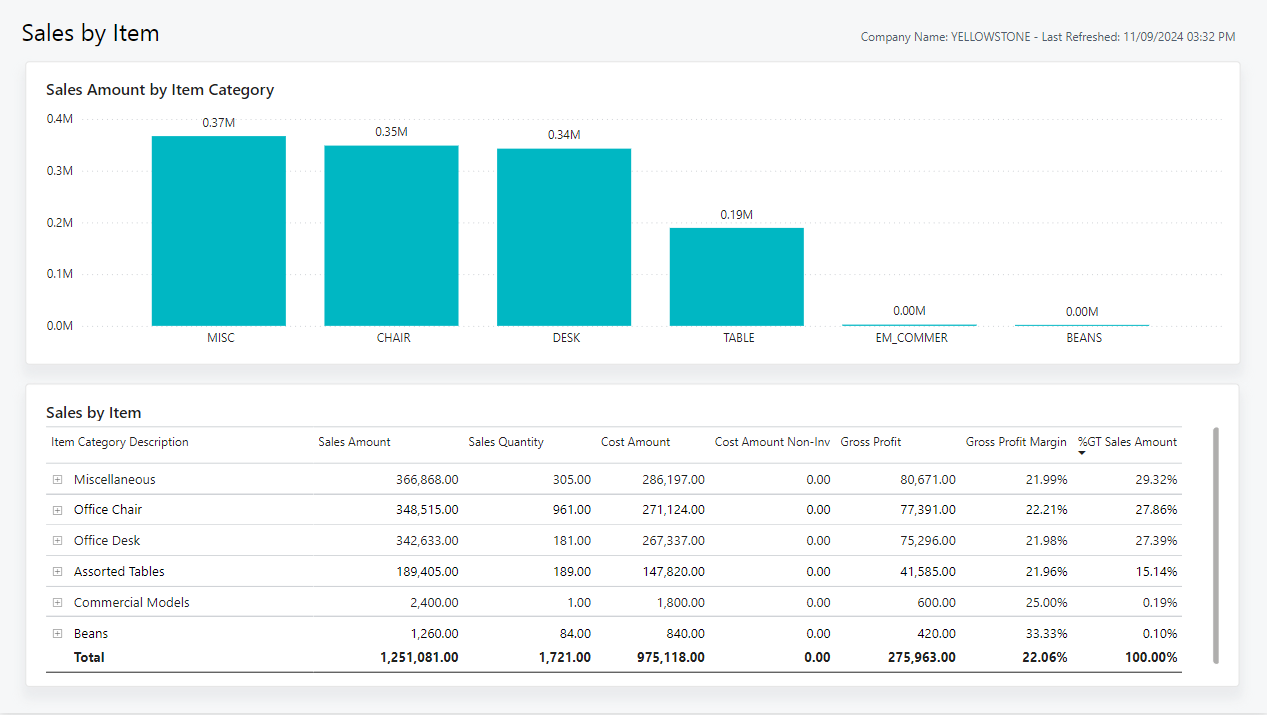
The Sales by Item report gives a clear picture of your organization's item sales. It showcases key metrics for each item or item category. For example, the sales amount, quantities, and the cost amounts. You can break down the information further by the specific customers that buy the items.
Use the report
Leadership and management teams use the report to track item sales. Sales teams can use it to better identify key items.
CEOs might want a list of the top-selling items by revenue, and be able to compare the list with how much each item contributed to the company's overall revenue. You can use this information to make strategic decisions about which items to focus on and how to allocate resources.
Sales managers can identify items that aren't performing and implement sales promotions for them. You can also use this information to adjust inventory levels of different items, procure extra stock to assist with demand, or reduce stock levels for slower periods.
Salespeople can tailor their pitch based on the sales performance for specific items. The report lets you identify high-performing items. You can also use this report to gain insights on lower-performing items so salespeople can spot opportunities to up-sell or cross-sell.
Key performance indicators
The report includes the following key performance indicators (KPIs) and measures:
- Sales (LCY)
- Sales Quantity
- Adjusted Cost (LCY)
- Cost Amount Non-Inv
- Adjusted Profit (LCY)
- Adjusted Profit Margin
Click on the link for a KPI to learn more about what it means, how it is calculated, and what data was used in the calculations.
Tip
Tip:
You can easily track the KPIs that the Power BI reports display against your business objectives. To learn more, go to Track your business KPIs with Power BI metrics.
Data used in the report
The report uses data from the following tables:
- Sales Value Entries
- Sales Invoice Lines
- Sales Credit Lines
- Project Ledger Entries
- Item
- Item Category
Try the report
Try the report here: Sales by Item
Tip
Tip:
If you hold down the CTRL key while you select the report link, the report opens on a new browser tab. In this way, you can stay on the current page while you explore the report on the other browser tab.
Related information
Track your business KPIs with Power BI metrics
Ad hoc analysis of sales data
Built-in sales reports
Sales analytics overview
Sales overview