Project analytics
Businesses capture lots of data during daily activities that supports business intelligence (BI) for project managers, such as:
- Cost performance for projects
- Completion rates for projects
- Financial data for projects
Business Central provides features to help you gather, analyze, and share your organization's project data:
- Power BI reports for projects
- Ad-hoc analysis on lists
- Ad-hoc analysis of data in Excel (using Open in Excel)
- Built-in project analytics tools
- Built-in project reports
Each of these features has its advantages and disadvantages, depending on the type of data analysis and the role of the user. To learn more, go to Analytics, business intelligence, and reporting overview.
This article introduces how you can use these analytical features to gain insights into your projects.
Analytics needs in projects
When you think about the analytics needs in projects management, it might help to use a persona-based model that describes different analytics needs at a high-level.

People in different roles have different needs when it comes to data, and they use the data in different ways. For example, people in project management interact with data differently than people in finance.

| Role | Data aggregation | Typical ways to consume data |
|---|---|---|
| COO / CFO / CEO | Performance data | KPIs, dashboards, financial reports |
| Project Manager | Trends, summaries | Built-in managerial reports, ad-hoc analysis |
| Project participant | Detailed data | Built-in operational reports, on-screen task data |
Using Power BI to monitor project KPIs
A key performance indicator (KPI) is a measurable value that shows how effectively you’re meeting your goals. In project management, people often use the following KPIs to monitor project performance:
- % Complete
- % Invoiced
- Realization %
- Actual Profit
- Actual Profit Margin %
- Actual (Total Cost)
- Budget (Total Cost)
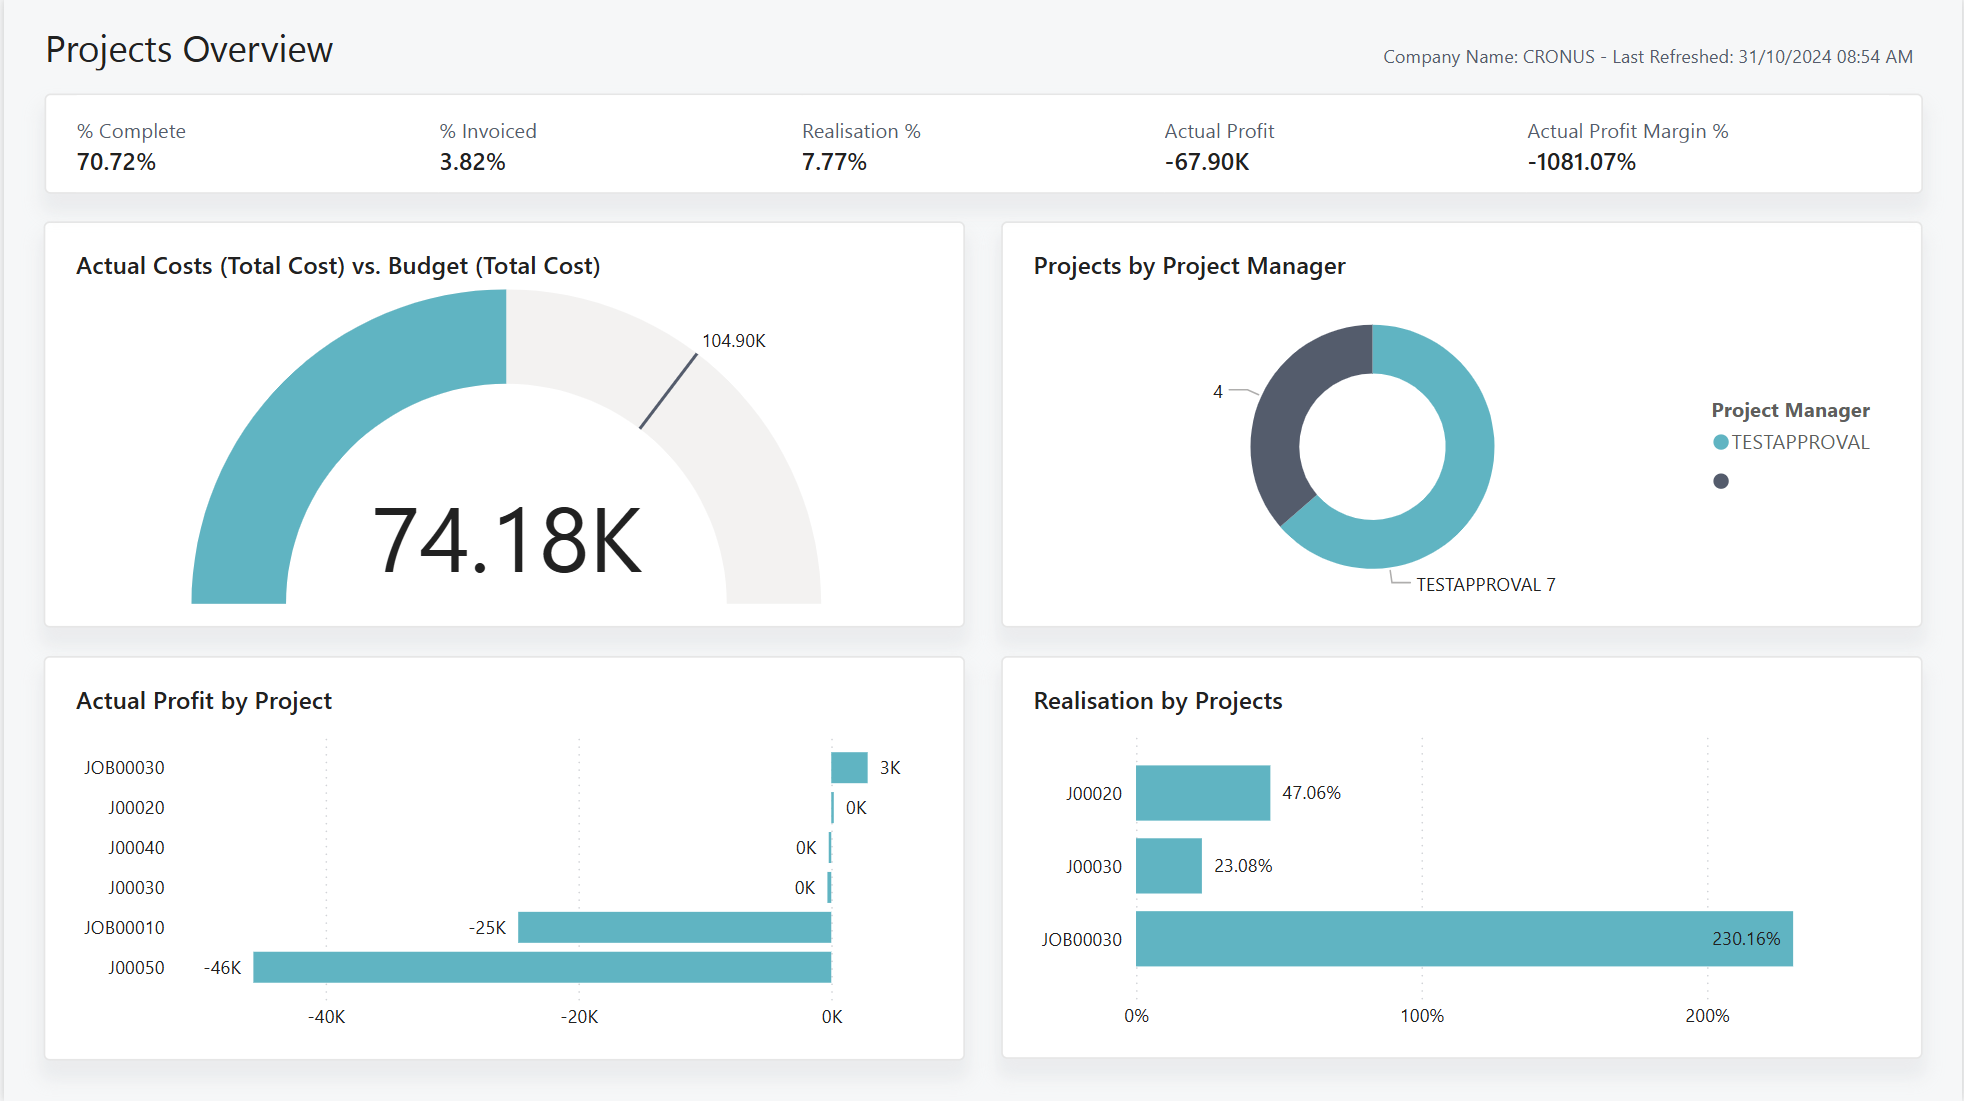
These KPIs (and more) are available for projects in the Project Power BI app for Business Central.
To learn more, go to Power BI Projects app.
Reports in the Power BI Projects app
The following table describes how you can use each report in the Power BI Projects app.
| To... | Open in Business Central (CTRL+select) | Learn more |
|---|---|---|
| Get a high-level view of your organization's projects. View key metrics and track performance across them. | Project Overview | About Projects Overview |
| View all projects and their tasks along with their costs and prices. | Project Tasks | About Project Tasks |
| Analyze the profit of each job and ensure you meet targets. | Project Profitability | Project Profitability (Power BI Report) |
| View project completion statistics. | Project Realization | About Projects Realization |
| Track the performance of each project and how they track toward their budget. | Project Performance to Budget | About Projects Performance to Budget |
| View all sales entries for projects broken down by the sales line type. | Project Invoiced Sales by Type | About Projects Invoiced Sales by Type |
| Analyze key sales information on projects based on the customers you sell to the most. | Project Invoiced Sales by Customer | About Projects Invoiced Sales by Customer |
| Analyze the schedules of each project task with a Gantt chart, detailing project tasks and their durations. | Project Timeline | About Project Timeline |
Tip
Tip:
You can easily track the KPIs that the Power BI reports display against your business objectives. To learn more, go to Track your business KPIs with Power BI metrics.
To learn more, go to Power BI Projects app.
Ad-hoc analysis of project data
Sometimes, you just need to check whether the numbers add up correctly, or quickly confirm a figure. The following features are great for ad-hoc analyses:
- Data analysis on ledger list pages
- Open in Excel
The Data Analysis feature lets you open almost any list page, such as Project Ledger Entries, enter analysis mode, and then group, filter, and pivot data as you see fit.
Similarly, you can use the Open in Excel action to open a list page, optionally filter the list to a subset of the data, and then use Excel to work with the data. For example, by using features such as Analyze Data, What-If Analysis, or Forecast Sheet.
Tip
Tip:
If you configure OneDrive for system features, the Excel workbook opens in your browser.
Built-in reports for projects
Business Central includes several built-in reports to help project organizations report on their data.
To get an overview of available reports, choose All Reports on your Home page. This action opens the Report Explorer, which is filtered to the features in the Report & Analysis option. Under the Project heading, choose Explore. To learn more, go to Finding Reports with the Role Explorer.
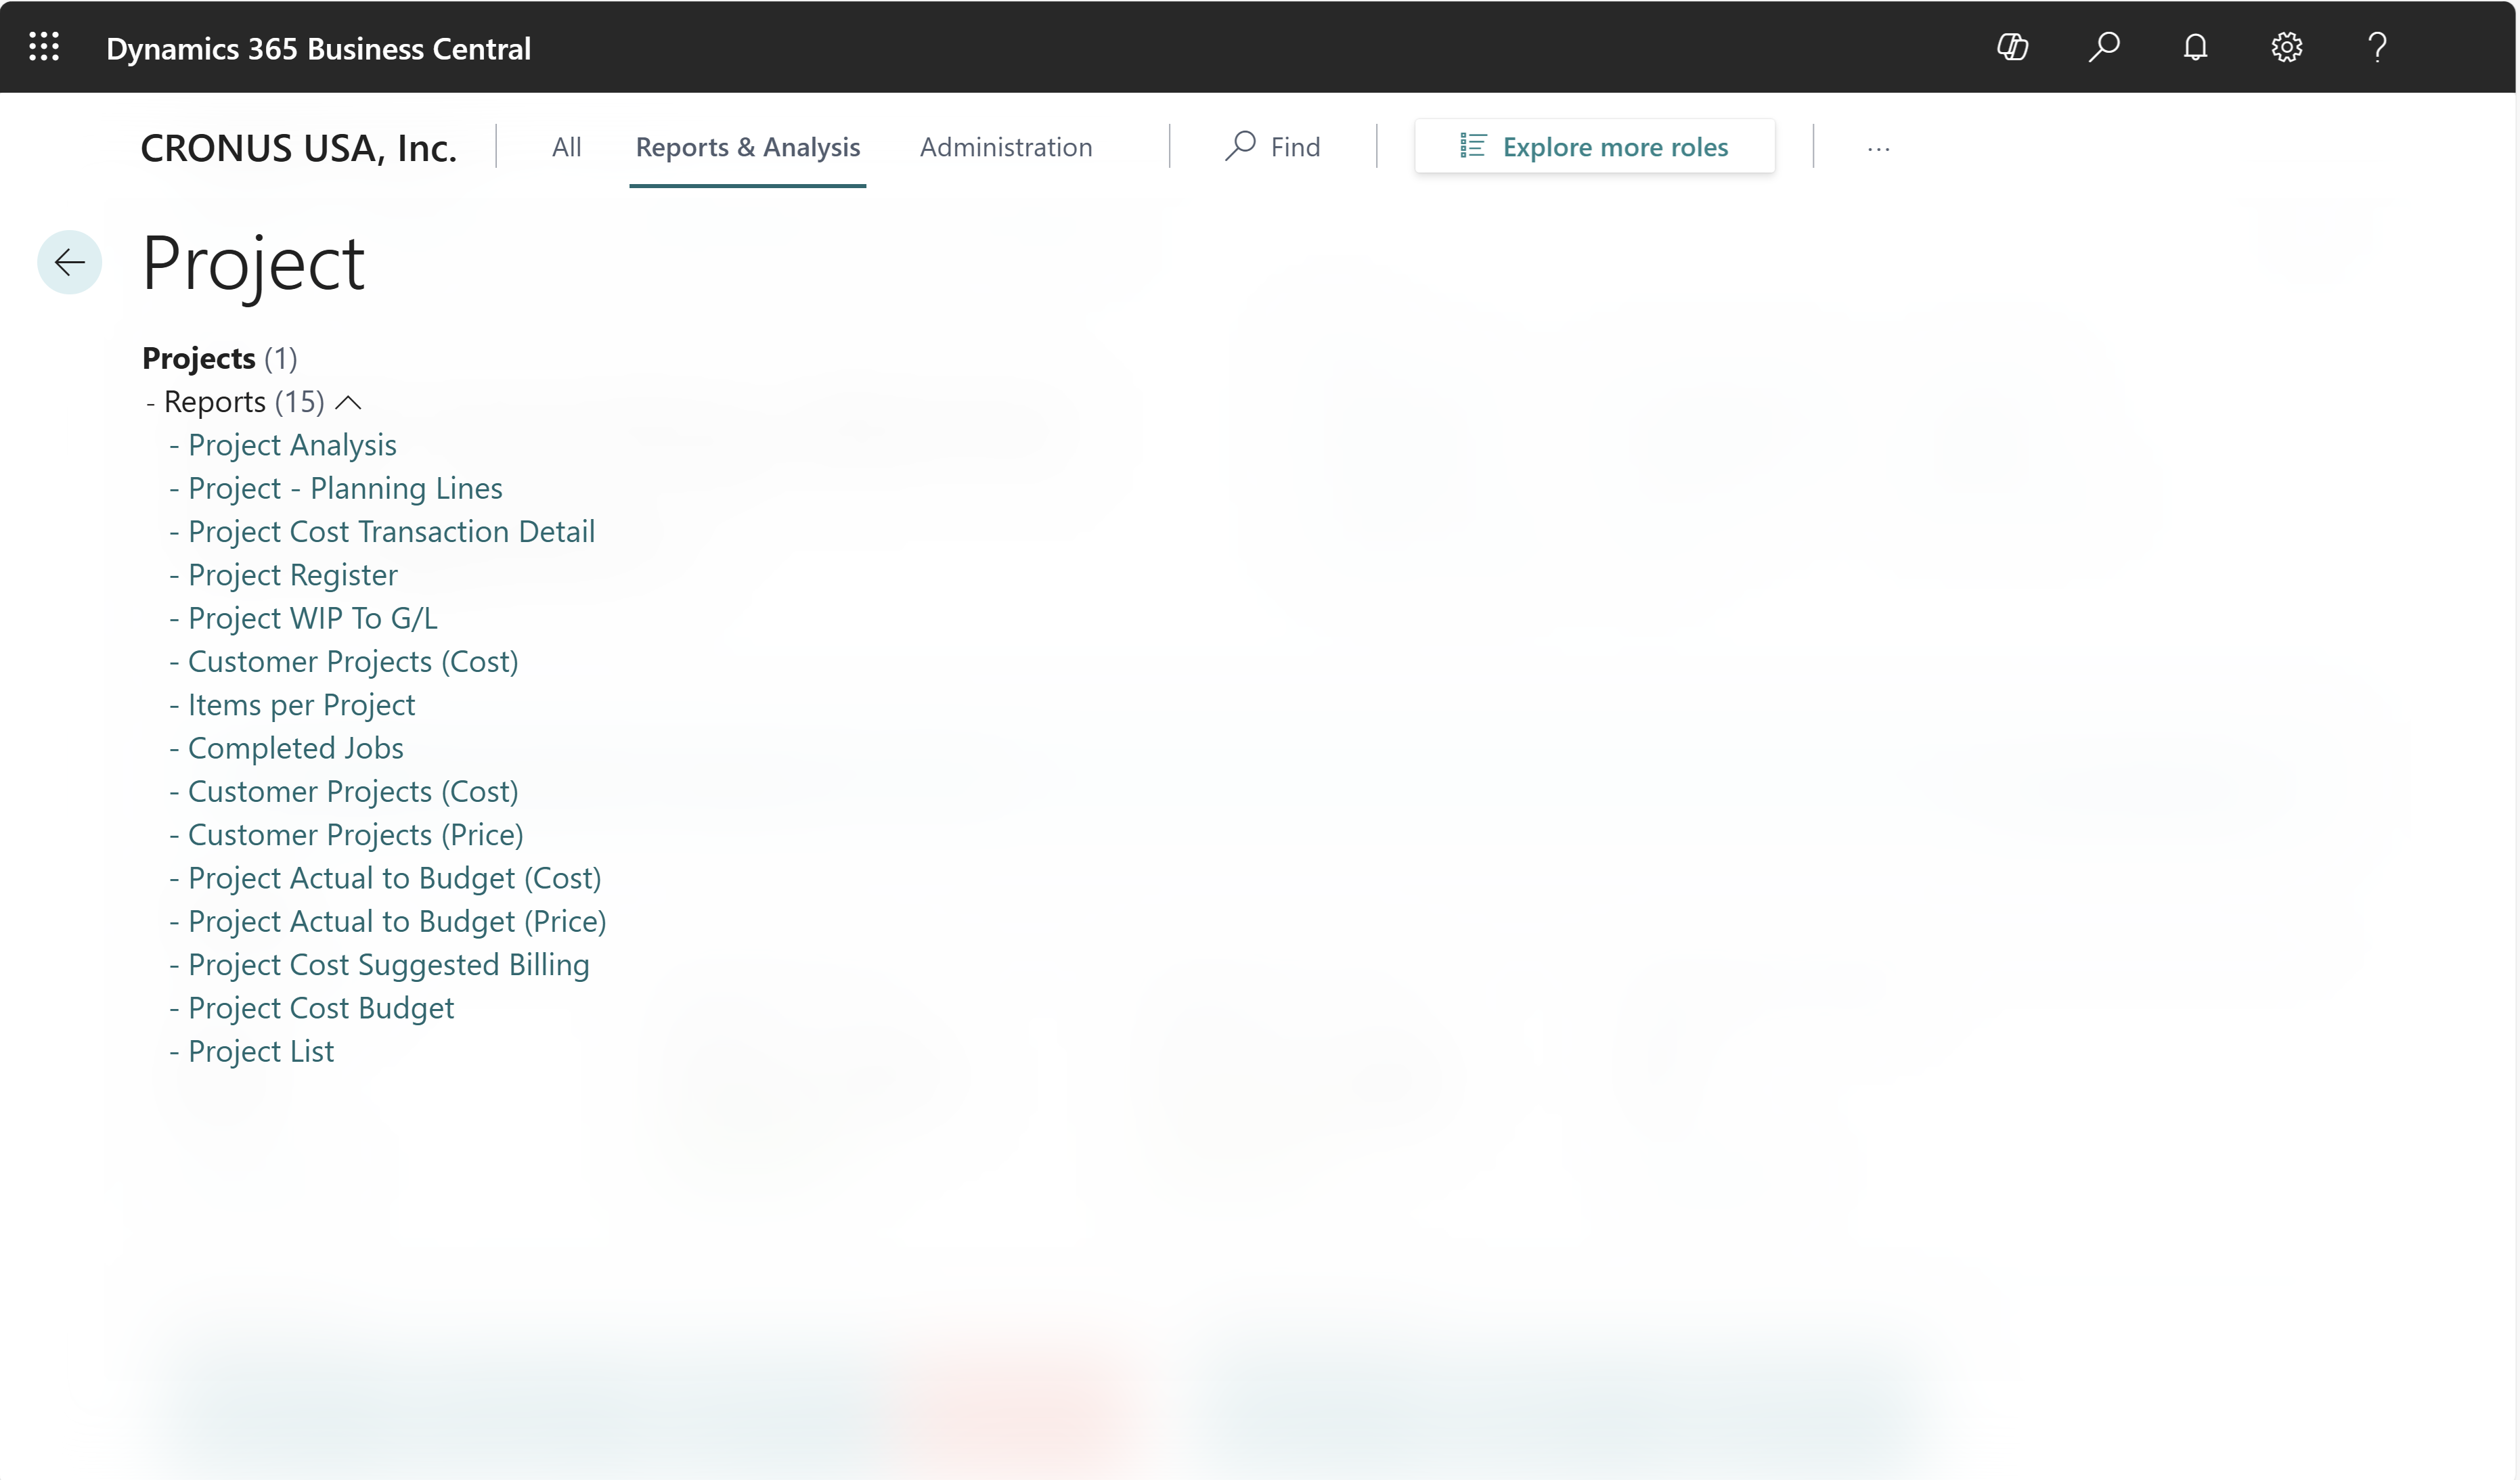
To learn more about reports that are relevant for project management, go to Built-in project reports.
On-screen project analytics
Business Central has several pages that give you project overviews and tasks to do, such as:
Related information
Power BI Projects app
Monitor project progress and performance
Built-in Projects reports
Project management overview