Project Overview (Power BI Report)
APPLIES TO: Generally available in Business Central 2024 release wave 2.
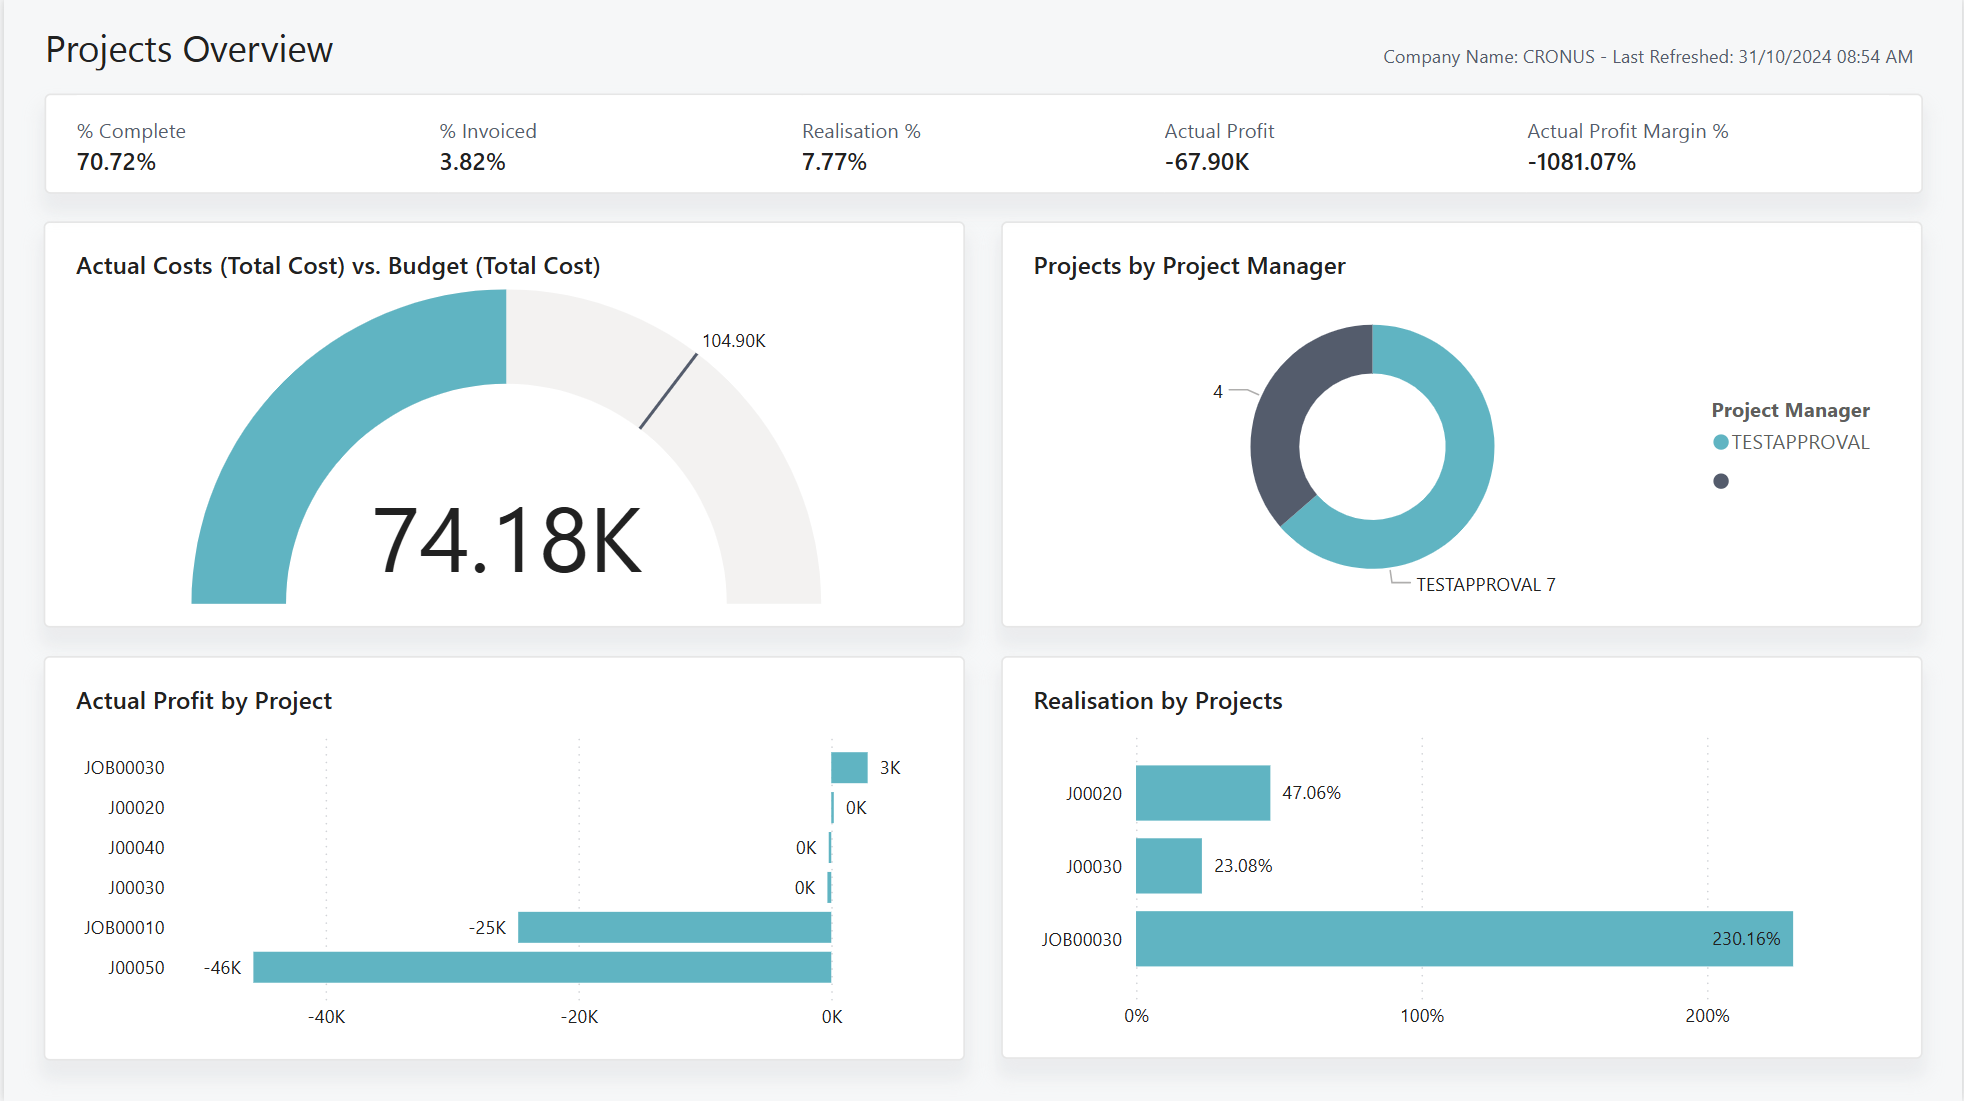
The Projects Overview report shows key metrics based on all ongoing projects for your organization and high-level summaries.
Use this report to investigate metrics such as the percent invoiced, percent complete, and other values that offer insights about the status your projects.
Use the report
Leadership and project managers use the report for high-level information about specific projects, and overall overview of the organization's projects.
People on leadership teams use the report to get a bird's eye view of your organizations projects. This view can show the overall progress of projects and break down your resource allocation per project manager. It shows high-level costing information, so you can identify where to make changes and ensure that projects are under budget.
Project managers use the report to gain a better understanding of the health of all your projects. The report helps them understand what's going well and what isn't, and where to make changes.
Key Performance Indicators (KPIs)
The Project Overview report includes the following KPIs:
- Completed (%)
- Invoiced (%)
- Realization (%)
- Actual Profit
- Actual Profit Margin %
- Actual (Total Cost)
- Budget (Total Cost)
- Project Count
- No. of Completed Projects
Click on the link for a KPI to learn more about what it means, how it is calculated, and what data was used in the calculations.
Tip
Tip:
You can easily track the KPIs that the Power BI reports display against your business objectives. To learn more, go to Track your business KPIs with Power BI metrics.
Data used in the report
The report uses data from the following tables in Business Central:
- Job
- Job Ledger Entry
- Job Planning Line
Try the report
Try the report here: Project Overview
Tip
Tip:
If you hold down the CTRL key while you select the report link, the report opens on a new browser tab. In this way, you can stay on the current page while you explore the report on the other browser tab.
Related information
Track your business KPIs with Power BI metrics
Power BI Projects app
Built-in Projects reports
Project management overview