Project Performance to Budget (Power BI Report)
APPLIES TO: Generally available in Business Central 2024 release wave 2.
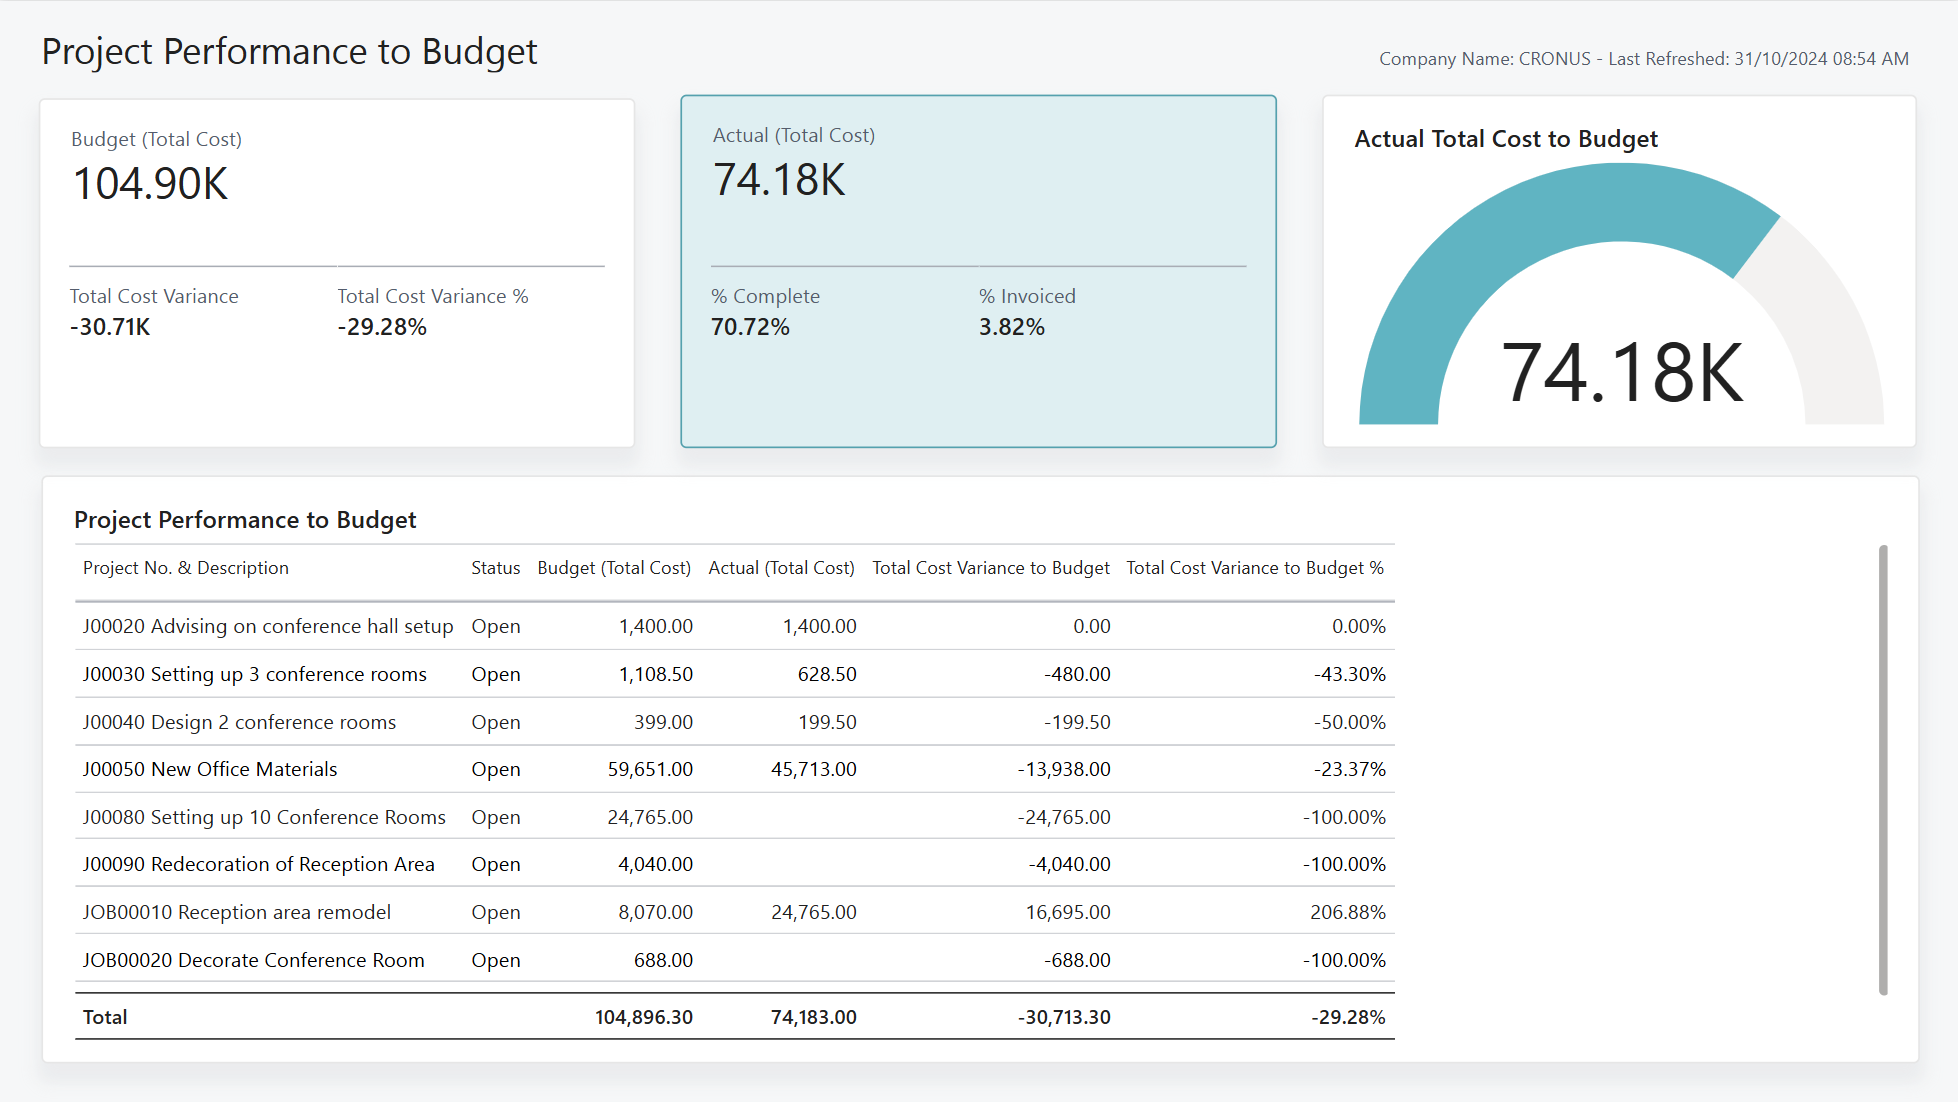
The Project Performance to Budget report can help you keep your projects under budget. For each project, it shows the total budget cost and the project's usage.
Use the report
Project managers want a clear view of projects to ensure they're on budget. The report lets them compare the budget and usage costs of each project.
Key Performance Indicators (KPIs)
The Project Performance to Budget report includes the following KPIs:
- Completed (%)
- Invoiced (%)
- Total Usage Cost
- Total Budget Cost
- Total Cost Variance to Budget
- Total Cost Variance to Budget %
Click on the link for a KPI to learn more about what it means, how it is calculated, and what data was used in the calculations.
Tip
Tip:
You can easily track the KPIs that the Power BI reports display against your business objectives. To learn more, go to Track your business KPIs with Power BI metrics.
Data used in the report
The report uses data from the following tables in Business Central:
- Job
- Job Ledger Entry
- Job Planning Line
Try the report
Try the report here: Project Performance to Budget
Tip
Tip:
If you hold down the CTRL key while you select the report link, the report opens on a new browser tab. In this way, you can stay on the current page while you explore the report on the other browser tab.
Related information
Track your business KPIs with Power BI metrics
Power BI Projects app
Built-in Projects reports
Project management analytics overview
Project management overview