Project Tasks (Power BI Report)
APPLIES TO: Generally available in Business Central 2024 release wave 2.
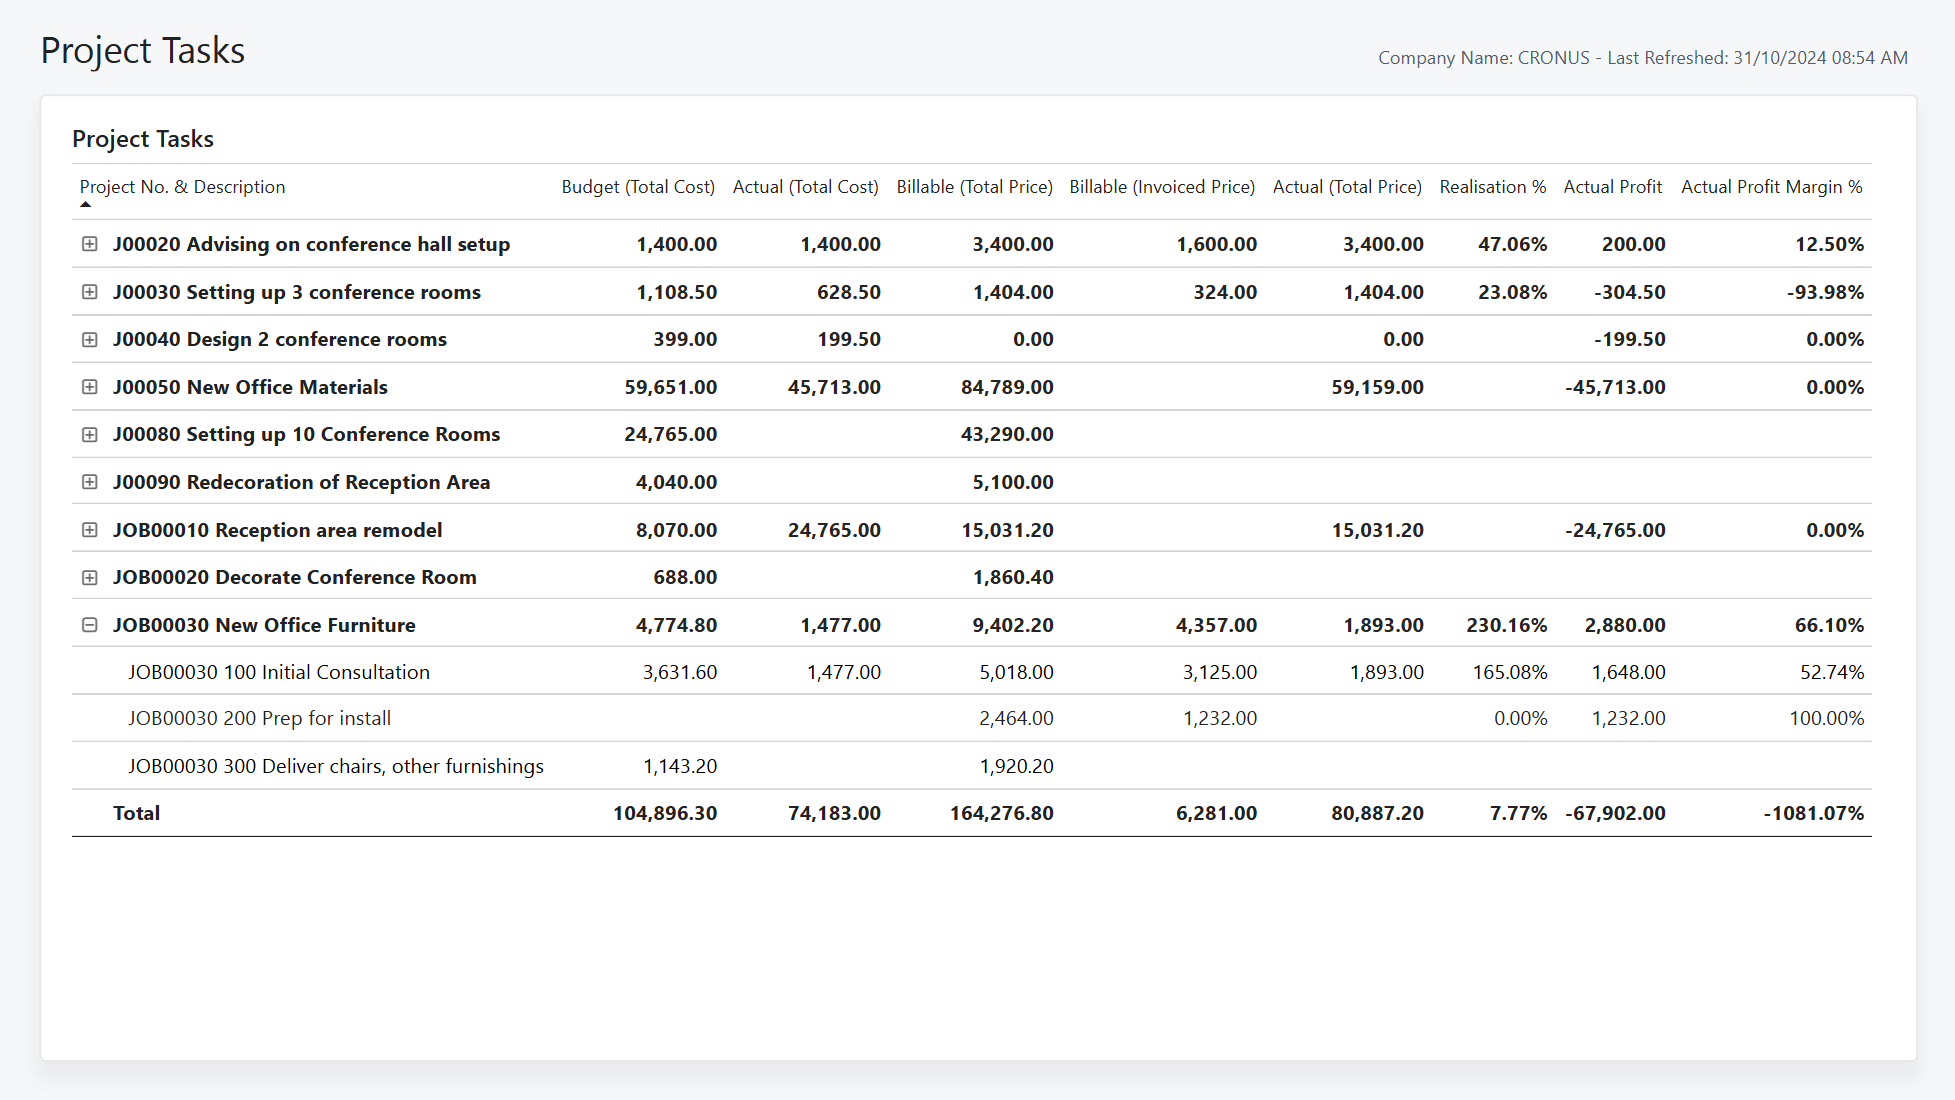
The Project Tasks report breaks down each project and shows metrics for their tasks so it easy to identify how each task is performing.
Use the report
Project Managers use the report to track the progress of project tasks and make good decisions about the resources involved. This report can also provide cost and pricing information to ensure you stay within budget.
Key Performance Indicators (KPIs)
The Project Tasks report includes the following KPIs:
- Actual (Total Price)
- Actual (Total Cost)
- Actual Profit
- Actual Profit Margin %
- Realization (%)
- Billable (Invoiced Price)
- Billable (Total Price)
- Budget (Total Cost)
Click on the link for a KPI to learn more about what it means, how it is calculated, and what data was used in the calculations.
Tip
Tip:
You can easily track the KPIs that the Power BI reports display against your business objectives. To learn more, go to Track your business KPIs with Power BI metrics.
Data used in the report
The report uses data from the following tables in Business Central:
- Job
- Job Task
- Job Planning Lines
- Job Ledger Entries
Try the report
Try the report here: Project Task
Tip
Tip:
If you hold down the CTRL key while you select the report link, the report opens on a new browser tab. In this way, you can stay on the current page while you explore the report on the other browser tab.
Related information
Track your business KPIs with Power BI metrics
Power BI Projects app
Built-in Projects reports
Project management analytics overview
Project management overview