Power BI Purchasing app
APPLIES TO: Generally available in Business Central 2024 release wave 2.
The Power BI Purchasing app for Business Central provides executives, purchasing managers, and procurement teams with valuable insights into purchasing activities. This app can help you streamline purchasing processes, improve decision-making at all levels of the organization, and optimize spending by offering detailed analytics and visualizations of purchasing data. Use its reports to increase transparency, efficiency, and cost savings in your daily operations.
Purchases analytics for the leadership team
To fit this category, you might have a role such as:
- Chief Executive Officer
- Chief Procurement Officer
Example scenario: preparing purchasing budgets
As the CEO of a manufacturing company, you need to stay on top of rising raw material costs to maintain profitability. For the leadership team, it's important to understand your organization's spending. The Purchases Overview and Moving Annual Total reports can give you a better understanding of how much money you spend on purchasing activities and quickly spot increases in raw material costs.

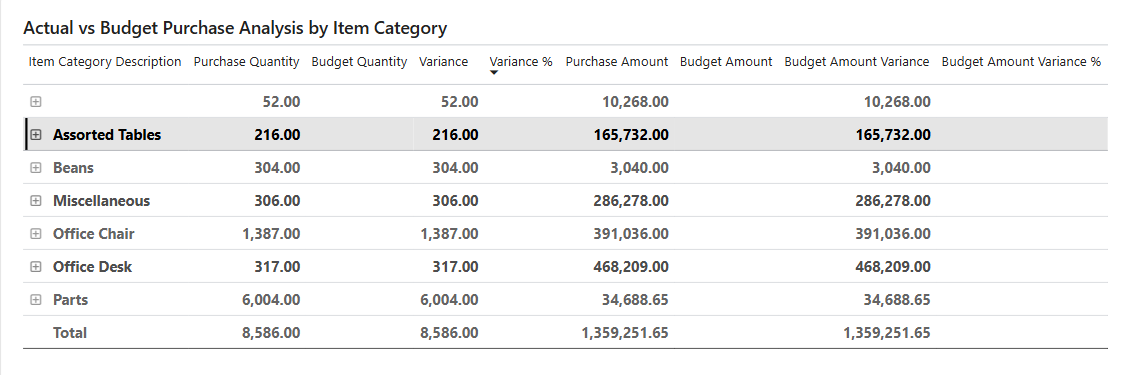
You can also use the Actual and Budget report to monitor the actual spending against the allocated budget. This comparison helps you make informed decisions to plan ahead for the coming months and years, giving you better budget control.
Purchases analytics for the management team
To fit this category, you might have a role such as:
- Purchasing Manager
- Operations Manager
Example scenario: reducing raw material costs
Purchase Managers in manufacturing ensure they have the materials they need to meet production demands. You notice an increase in the cost of a material, which could affect profitability. Using the Purchases Decomposition and Purchases by Item reports, you can quickly identify the vendor that provides the material and analyze the purchase amount compared to the previous year. This information can help you negotiate better prices with the vendor.
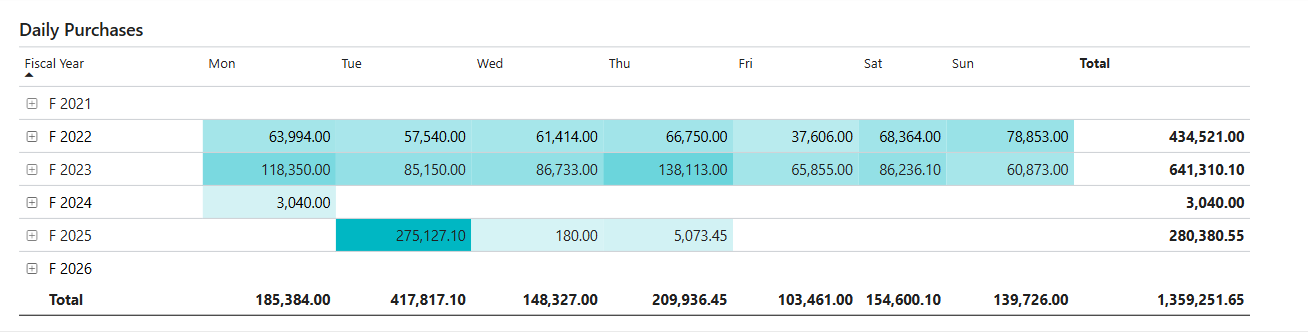
To monitor purchasing activities and ensure compliance with weekly or monthly budgets, the Daily Purchases report provides a detailed breakdown of purchase amounts. It aggregates amounts by day, week, month, and year. Use this report to spot unexpected spikes in spending and take corrective action before it affects your budget.
Also, you can use the Moving Averages report to analyze purchasing trends and identify opportunities to reduce costs and improve efficiency. The Purchases by Location report can help you find discrepancies in purchasing patterns across different locations and make decisions.
Purchases analytics for daily purchasing work
To fit this category, you might have a role such as:
- Purchasing Agent
- Purchasing Officer
Example scenario: selecting vendors for purchasing raw materials
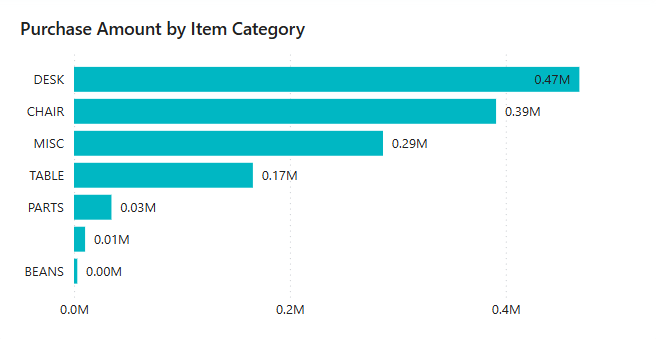
As a purchaser for a manufacturing company, you source materials for production. Part of your role is to keep purchasing costs under control to maintain profitability in the allocated budget. Use the Purchases by Item report to see the breakdown of purchases by item and category.
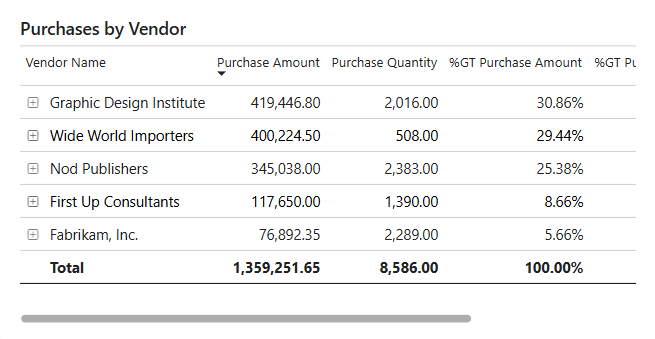
You notice that the company spent significantly on a particular category of materials. The purchase amount increased compared to the previous year. You decide to investigate by looking at the Purchases by Vendor report, which shows the breakdown of purchases by vendor.
You identify that one vendor consistently provided the materials at a higher price than other vendors. To analyze spending and manage your supplier relationship, use the Purchases by Vendor report. The report shows the purchasing activities for each vendor, including the amount spent, the number of transactions, and the vendors that supplied a specific category of material.
Use the reports in the Power BI Purchases app
The following table describes how you can use the reports in the Power BI Purchases app.
| To... | Open in Business Central (CTRL+select) | Learn more |
|---|---|---|
| Get a high-level summary of all purchasing activities. View purchase statistics such as summaries of amounts, outstanding amounts, amounts received but not invoiced, and invoiced amounts. | Purchases Overview | About Purchases Overview |
| Explore the costs of various components on purchases with a detailed breakdown of your purchasing data by categories, vendors, fiscal month, year, and document types. | Purchase Decomposition | About Purchases Decomposition |
| Analyze daily purchasing activities and highlight trends and exceptions in daily spend. Monitor day-to-day purchase fluctuations and identify unusual spending patterns. | Daily Purchases | About Daily Purchases |
| Analyze the 30-day moving average of your purchases, compare it to the total purchase amount, and identify purchasing trends and patterns. | Moving Averages | About Moving Averages |
| Get an overview of the total of all purchases over a rolling 12-month period for long-term trend analysis and forecasting. | Moving Annual Total | About Moving Annual Total |
| Compare your purchasing data across different time periods. You can compare at the year, quarter, or month levels, and identify how purchases track across these periods. | Period-Over-Period | About Period-Over-Period |
| Gain insights into your purchasing performance over time. Identify trends or patterns that emerge over time. | Year-Over-Year | About Year-Over-Year |
| Analyze purchasing activities by vendor by item to gain a better understanding of the items that consume a significant portion of your purchasing budget. | Purchases by Item | About Purchases by Item |
| Analyze purchasing activities by vendor to identify which vendors are responsible for most of your purchasing activity. | Purchases by Vendor | About Purchases by Vendor |
| Analyze purchasing activities by purchaser to manage your purchasing teams and individual performance. | Purchases by Purchaser | About Purchases by Purchaser |
| Gain a comprehensive view of your purchase data across different warehouse locations, and identify trends and patterns in their purchasing activities. | Purchases by Location | About Purchases by Location |
| Compare actual spending to allocated budget to ensure that spending aligns with financial plans. | Actual vs Budget | About Actual vs. Budget |
Tip
Tip:
You can easily track the KPIs that the Power BI reports display against your business objectives. To learn more, go to Track your business KPIs with Power BI metrics.
Related information
Installing Power BI apps for Business Central
Track KPIs with Power BI metrics
Ad hoc analysis of purchasing data
Built-in purchasing reports
Purchasing analytics overview
Purchasing overview