Year-Over-Year (Power BI Report)
APPLIES TO: Generally available in Business Central 2024 release wave 2.
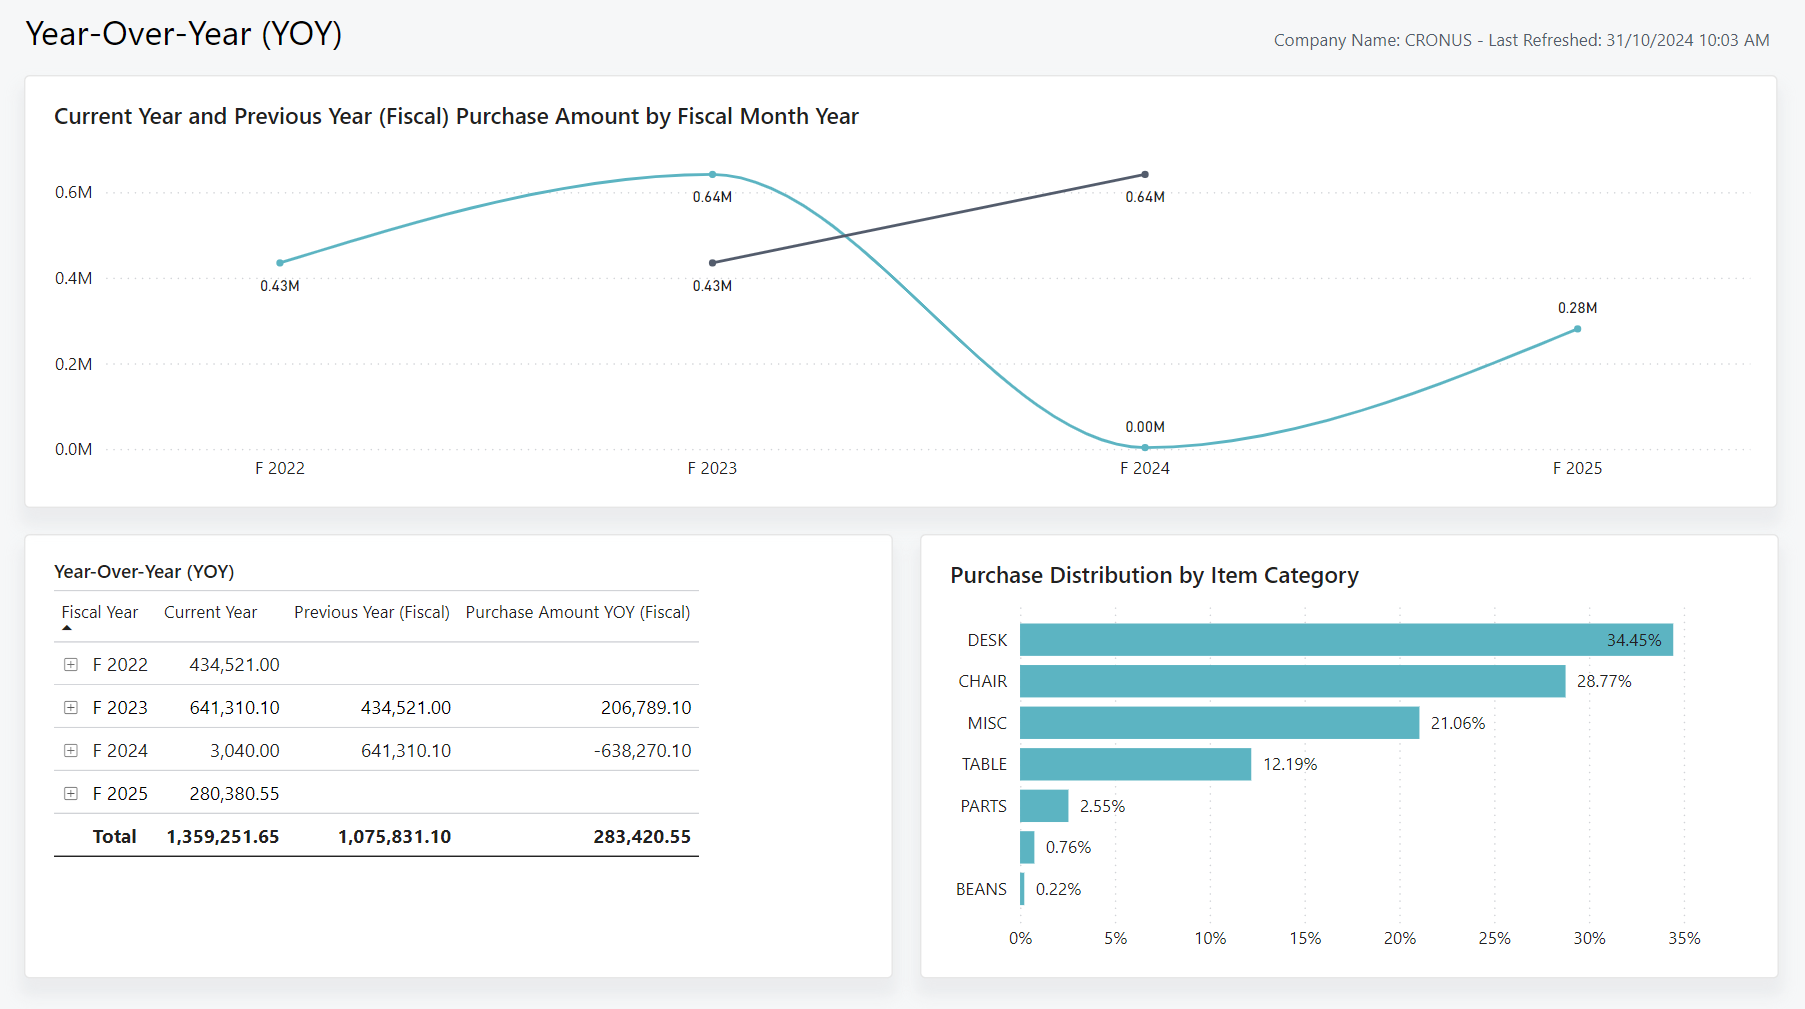
The Year-Over-Year report helps business leaders analyze purchasing performance and track spending trends over time. By comparing purchase amounts in the current year with amounts from the previous year, this report provides valuable insights into the efficiency and effectiveness of purchasing activities.
In addition to identifying trends and changes, the report helps leaders make informed decisions about future purchasing strategies. It's an important indicator of growth and spending patterns, providing an overview of the money you spend to make products and generate revenues.
Together with year-over-year financial figures, the report gives a comprehensive view of an organization's financial health. Tracking these figures helps leaders make informed decisions about resource allocation, budgeting, and forecasting.
Use the report
The report is intended for business leaders and managers.
COOs ensure that the purchasing department operates efficiently and effectively. One of the key metrics you monitor is the year-over-year growth in purchases. This report lets you quickly explore purchase trends over time, and identify areas of concern. For example, you might notice that purchases are increasing rapidly in a particular item category. You can use this information to discuss how to manage costs with the head of purchasing.
Purchasing managers ensure that the company sources goods at the best price without compromising quality. Use this report to track purchasing trends across different categories and identify areas where you can save. For example, you might notice a rapid increase in purchases of a category of products. With this information in mind, you can work with the manufacturing team to identify whether to change item planning or supplier selection to optimize product cost and quality.
Key Performance Indicators (KPIs)
The Year-Over-Year report includes the following KPIs and measures:
Click on the link for a KPI to learn more about what it means, how it is calculated, and what data was used in the calculations.
Tip
Tip:
You can easily track the KPIs that the Power BI reports display against your business objectives. To learn more, go to Track your business KPIs with Power BI metrics.
Data used in the report
The report uses data from the following tables in Business Central:
- Purchase Value Entry
- Purchase Invoice Lines
- Purchase Credit Lines
- Item Category
Try the report
Try the report here: Year-Over-Year
Tip
Tip:
If you hold down the CTRL key while you select the report link, the report opens on a new browser tab. In this way, you can stay on the current page while you explore the report on the other browser tab.
Related information
Track KPIs with Power BI metrics
Power BI Purchasing app
Ad hoc analysis of purchasing data
Built-in purchasing reports
Purchasing analytics overview
Purchasing overview