Inventory analytics
Businesses capture lots of data during daily activities that supports business intelligence (BI) for inventory managers:
- Shipping of goods when sales orders are fulfilled.
- Receipts of items when purchase orders are fulfilled.
- Movements of items between locations.
Business Central provides features to help you gather, analyze, and share your organization's inventory data:
- Power BI reports for inventory
- Ad-hoc analysis on lists
- Ad-hoc analysis of data in Excel (using Open in Excel)
- Built-in inventory analytics tools
- Built-in inventory reports
Each of these features has its advantages and disadvantages, depending on the type of data analysis and the role of the user. To learn more, go to Analytics, business intelligence, and reporting overview.
This article introduces how you can use these analytical features to gain insights into your inventory.
Analytics needs in inventory
When you think about the analytics needs in inventory management, it might help to use a persona-based model that describes different analytics needs at a high-level.

People in different roles have different needs when it comes to data, and they use the data in different ways. For example, people in asset management and finance interact with data differently than people in sales.

| Role | Data aggregation | Typical ways to consume data |
|---|---|---|
| COO / CFO / CEO | Performance data | KPIs, dashboards, financial reports |
| Inventory Manager | Trends, summaries | Built-in managerial reports, ad-hoc analysis |
| Warehouse worker | Detailed data | Built-in operational reports, on-screen task data |
Using Power BI to monitor inventory KPIs
A key performance indicator (KPI) is a measurable value that shows how effectively you’re meeting your goals. In inventory management, people often use the following KPIs to monitor their core inventory performance:
- Number of Scheduled Receipt
- Number of Planned Order Receipt
- Gross Requirement
- Projected Available Balance
- Quantity on Sales Orders, Purchase Returns, Service Orders, Projects, Production Orders, or Assemply Component
- Inventory by Item/Location/Lot/Serial No.
For inventory valuation, you can use the following KPIs to monitor the value kept in your inventory:
- Ending balance inventory value
- Variance by item/location
- Invoiced Quantity
- Increases/Decreases in quantity (by item/location)
All of these purchasing KPIs (and more) are available in the Inventory Power BI apps for Business Central.
To learn more, go to:
Reports in the Power BI Inventory app
The following table describes how you can use each report in the Power BI Inventory app.
| To... | Open in Business Central (CTRL+select) | Learn more |
|---|---|---|
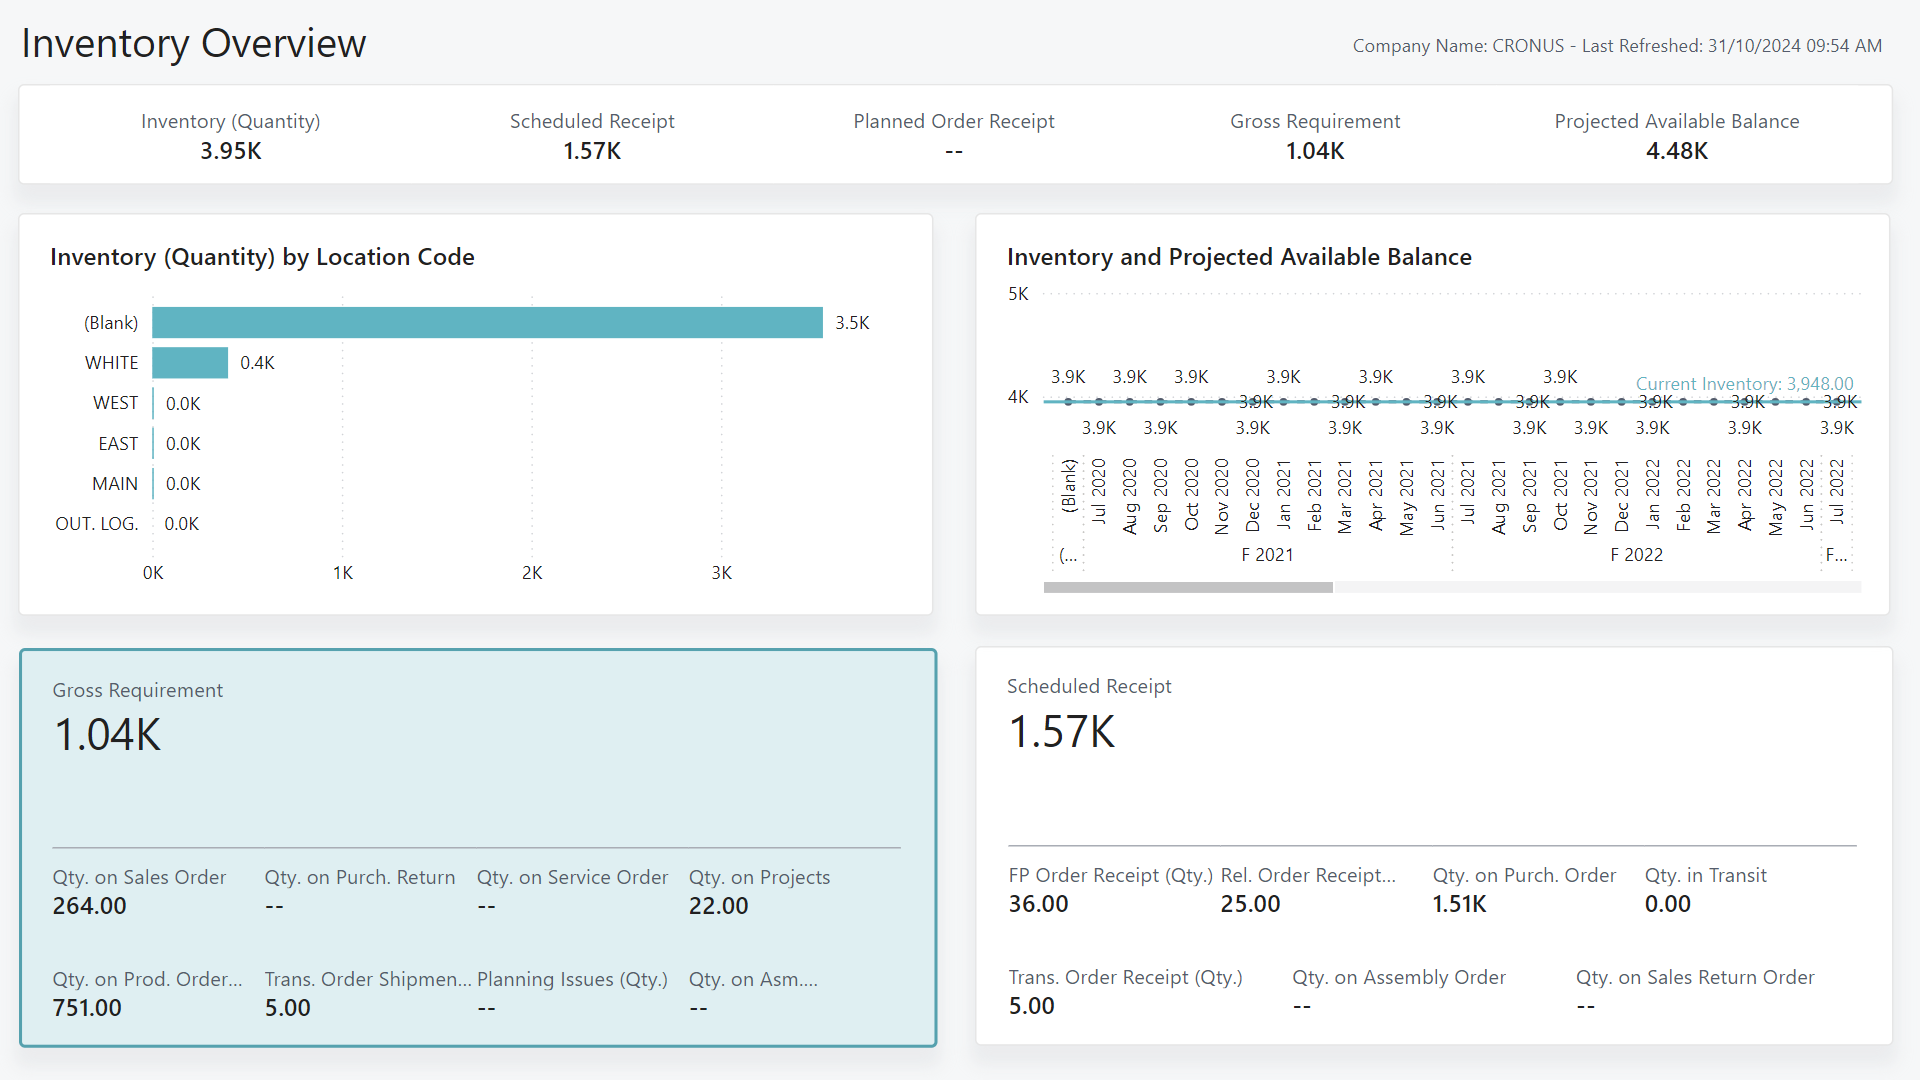
| Get a high-level view of your organizations inventory and view statistics on scheduled receipt, gross requirements, and inventory across locations. | Inventory Overview | About Inventory Overview |
| Review inventory levels for items and gauge how many of an item are on different document types. | Inventory by Item | About Inventory by Item |
| Review inventory levels at a location to identify where you keep stock. | Inventory by Location | About Inventory by Location |
| Analyze sales and purchase quantities to meet supply and demand. | Purchase and Sales Quantity | About Purchase and Sales Quantity |
| Get a high-level view of inventory along with the gross requirements, scheduled receipts, and planned production volume. | Item Availability | About Item Availability |
| Analyze the volume of stock required to meet demand broken down by document type. | Gross Requirement | About Gross Requirement |
| Analyze the volume of stock you received broken down by document type. | Scheduled Receipt | About Scheduled Receipt |
| View inventory quantities based on lot numbers. | Inventory by Lot | About Inventory by Lot |
| View inventory quantities based on serial numbers. | Inventory by Serial No. | About Inventory by Serial No. |
| Analyze inventory levels across different bins and identify bins that have active picks. | Bin Contents | About Bin Contents |
| Analyze inventory levels across bins and tracking information for the items. | Bin Contents by Item Tracking | About Bin Contents by Item Tracking |
Tip
Tip:
You can easily track the KPIs that the Power BI reports display against your business objectives. To learn more, go to Track your business KPIs with Power BI metrics.
To learn more, go to Power BI Inventory app.
Reports in the Power BI Inventory Valuation app
The following table describes on how you can use each report in the inventory valuation app.
| To... | Open in Business Central (CTRL+select) | Learn more |
|---|---|---|
| Get a high-level view of your inventory value and identify key balances. | [Inventory Valuation Overviewhttps://businesscentral.dynamics.com?page=37056) | About Inventory Valuation Overview |
| Review inventory valuation at an item level and see key value figures, including increases and decreases. | [Inventory Valuation by Itemhttps://businesscentral.dynamics.com?page=37057) | About Inventory Valuation by Item |
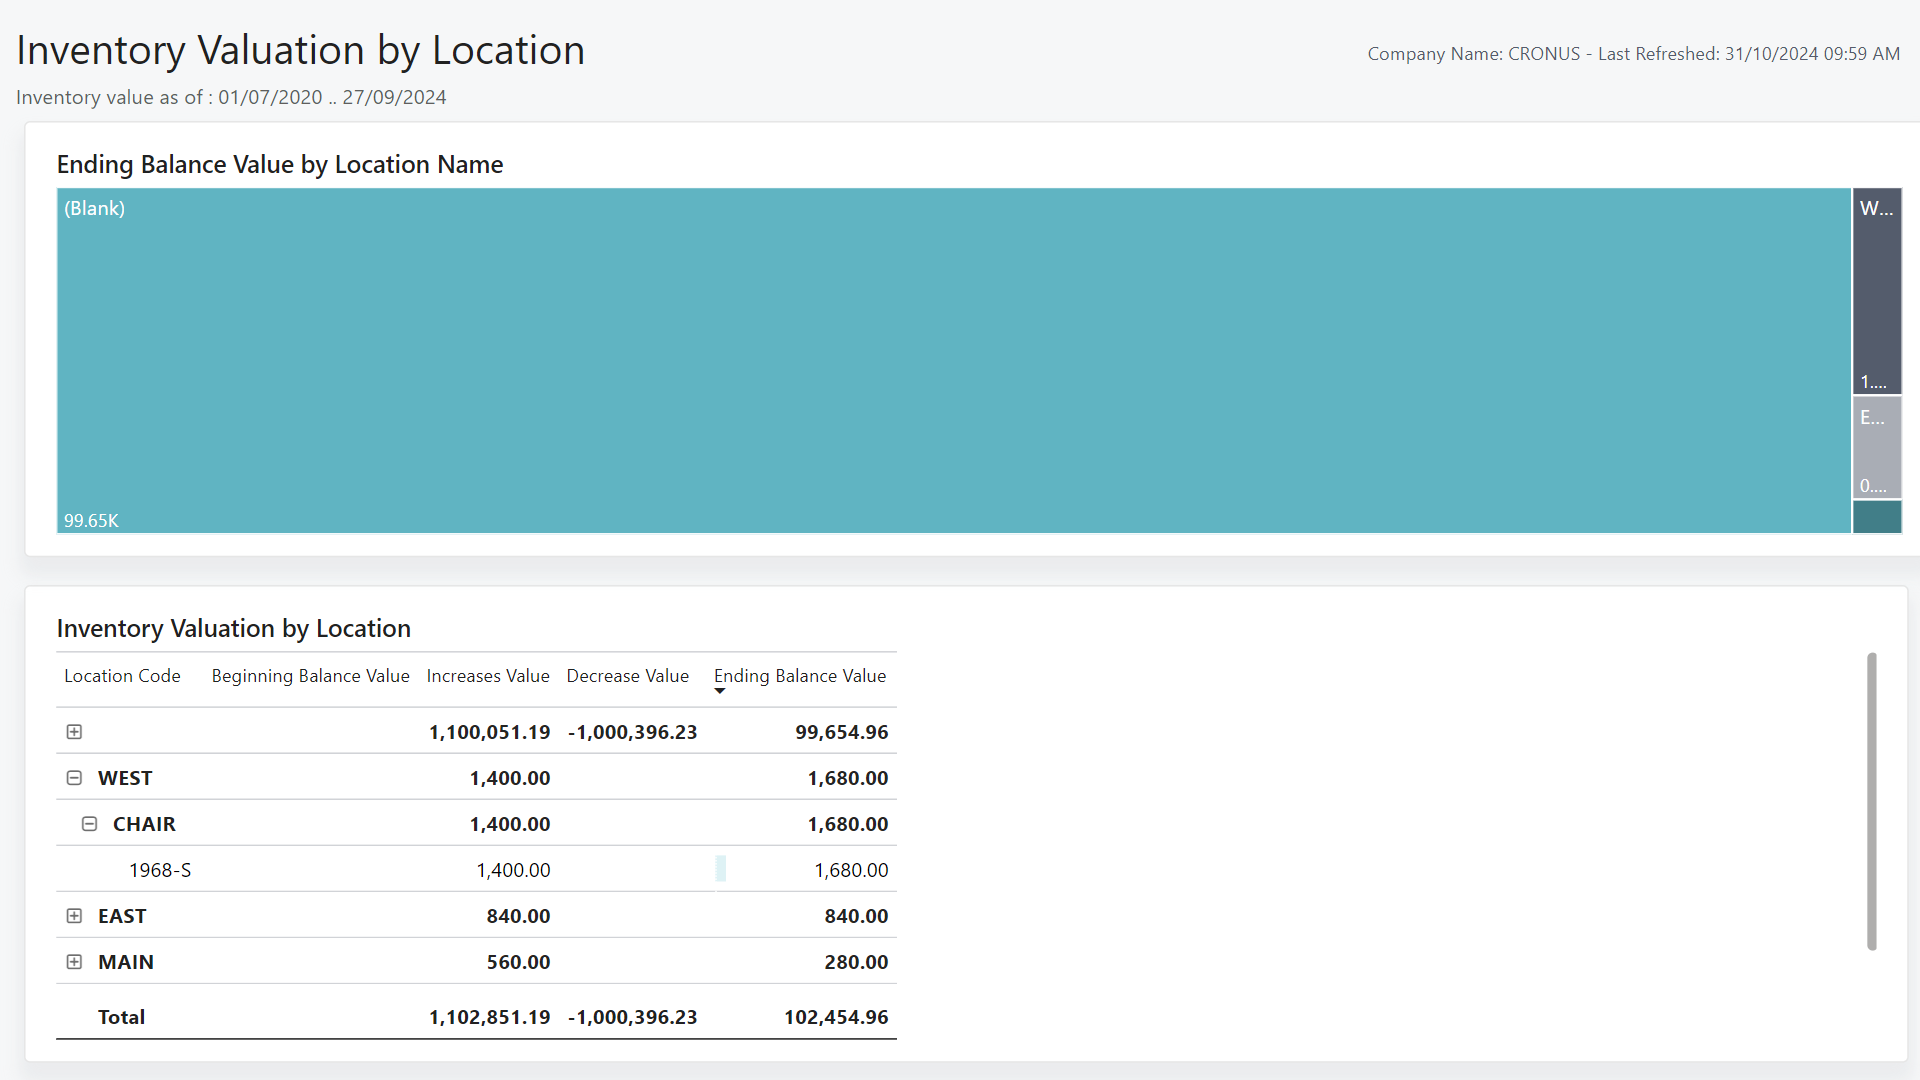
| Review inventory valuation at a location level and see key value figures, including increases and decreases. | [Inventory Valuation by Locationhttps://businesscentral.dynamics.com?page=37058) | About Inventory Valuation by Location |
Tip
Tip:
You can easily track the KPIs that the Power BI reports display against your business objectives. To learn more, go to Track your business KPIs with Power BI metrics.
To learn more, go to Power BI Inventory Valuation app.
Use financial reporting to produce financial statements and KPIs related to inventory
The Financial Reporting feature gives you insights into the financial data shown on your chart of accounts (COA). You can set up financial reports to analyze figures in general ledger (G/L) accounts, and compare general ledger entries with budget entries. Specifically for inventory management, you can set up financial reports on the general ledger (G/L) accounts that you use to track inventory postings.
Dimensions play an important role in business intelligence. A dimension is data that you add to an entry as a parameter. Dimensions let you group entries that have similar characteristics, such as customers, regions, products, and salesperson. Among other purposes, use dimensions when you define analysis views and create financial reports. To learn more, go to Work with Dimensions.
To learn more about financial reports, go to Prepare Financial Reports with Financial Data and Account Categories.
Finance reporting across business units or legal entities (related to inventory)
Some organizations use Business Central in multiple business units or legal entities. Others use Business Central in subsidiaries that report to parent organizations. Business Central gives accountants tools that help them transfer general ledger entries from two or more companies (subsidiaries) into a consolidated company. Specifically for inventory management, you might want to consolidate general ledger entries for your inventory accounts to be able to track sales KPIs across business units or legal entities.
To learn more, go to Company consolidation.
Ad-hoc analysis of inventory data
Sometimes, you just need to check whether the numbers add up correctly, or quickly confirm a figure. The following features are great for ad-hoc analyses:
- Data analysis on ledger list pages
- Open in Excel
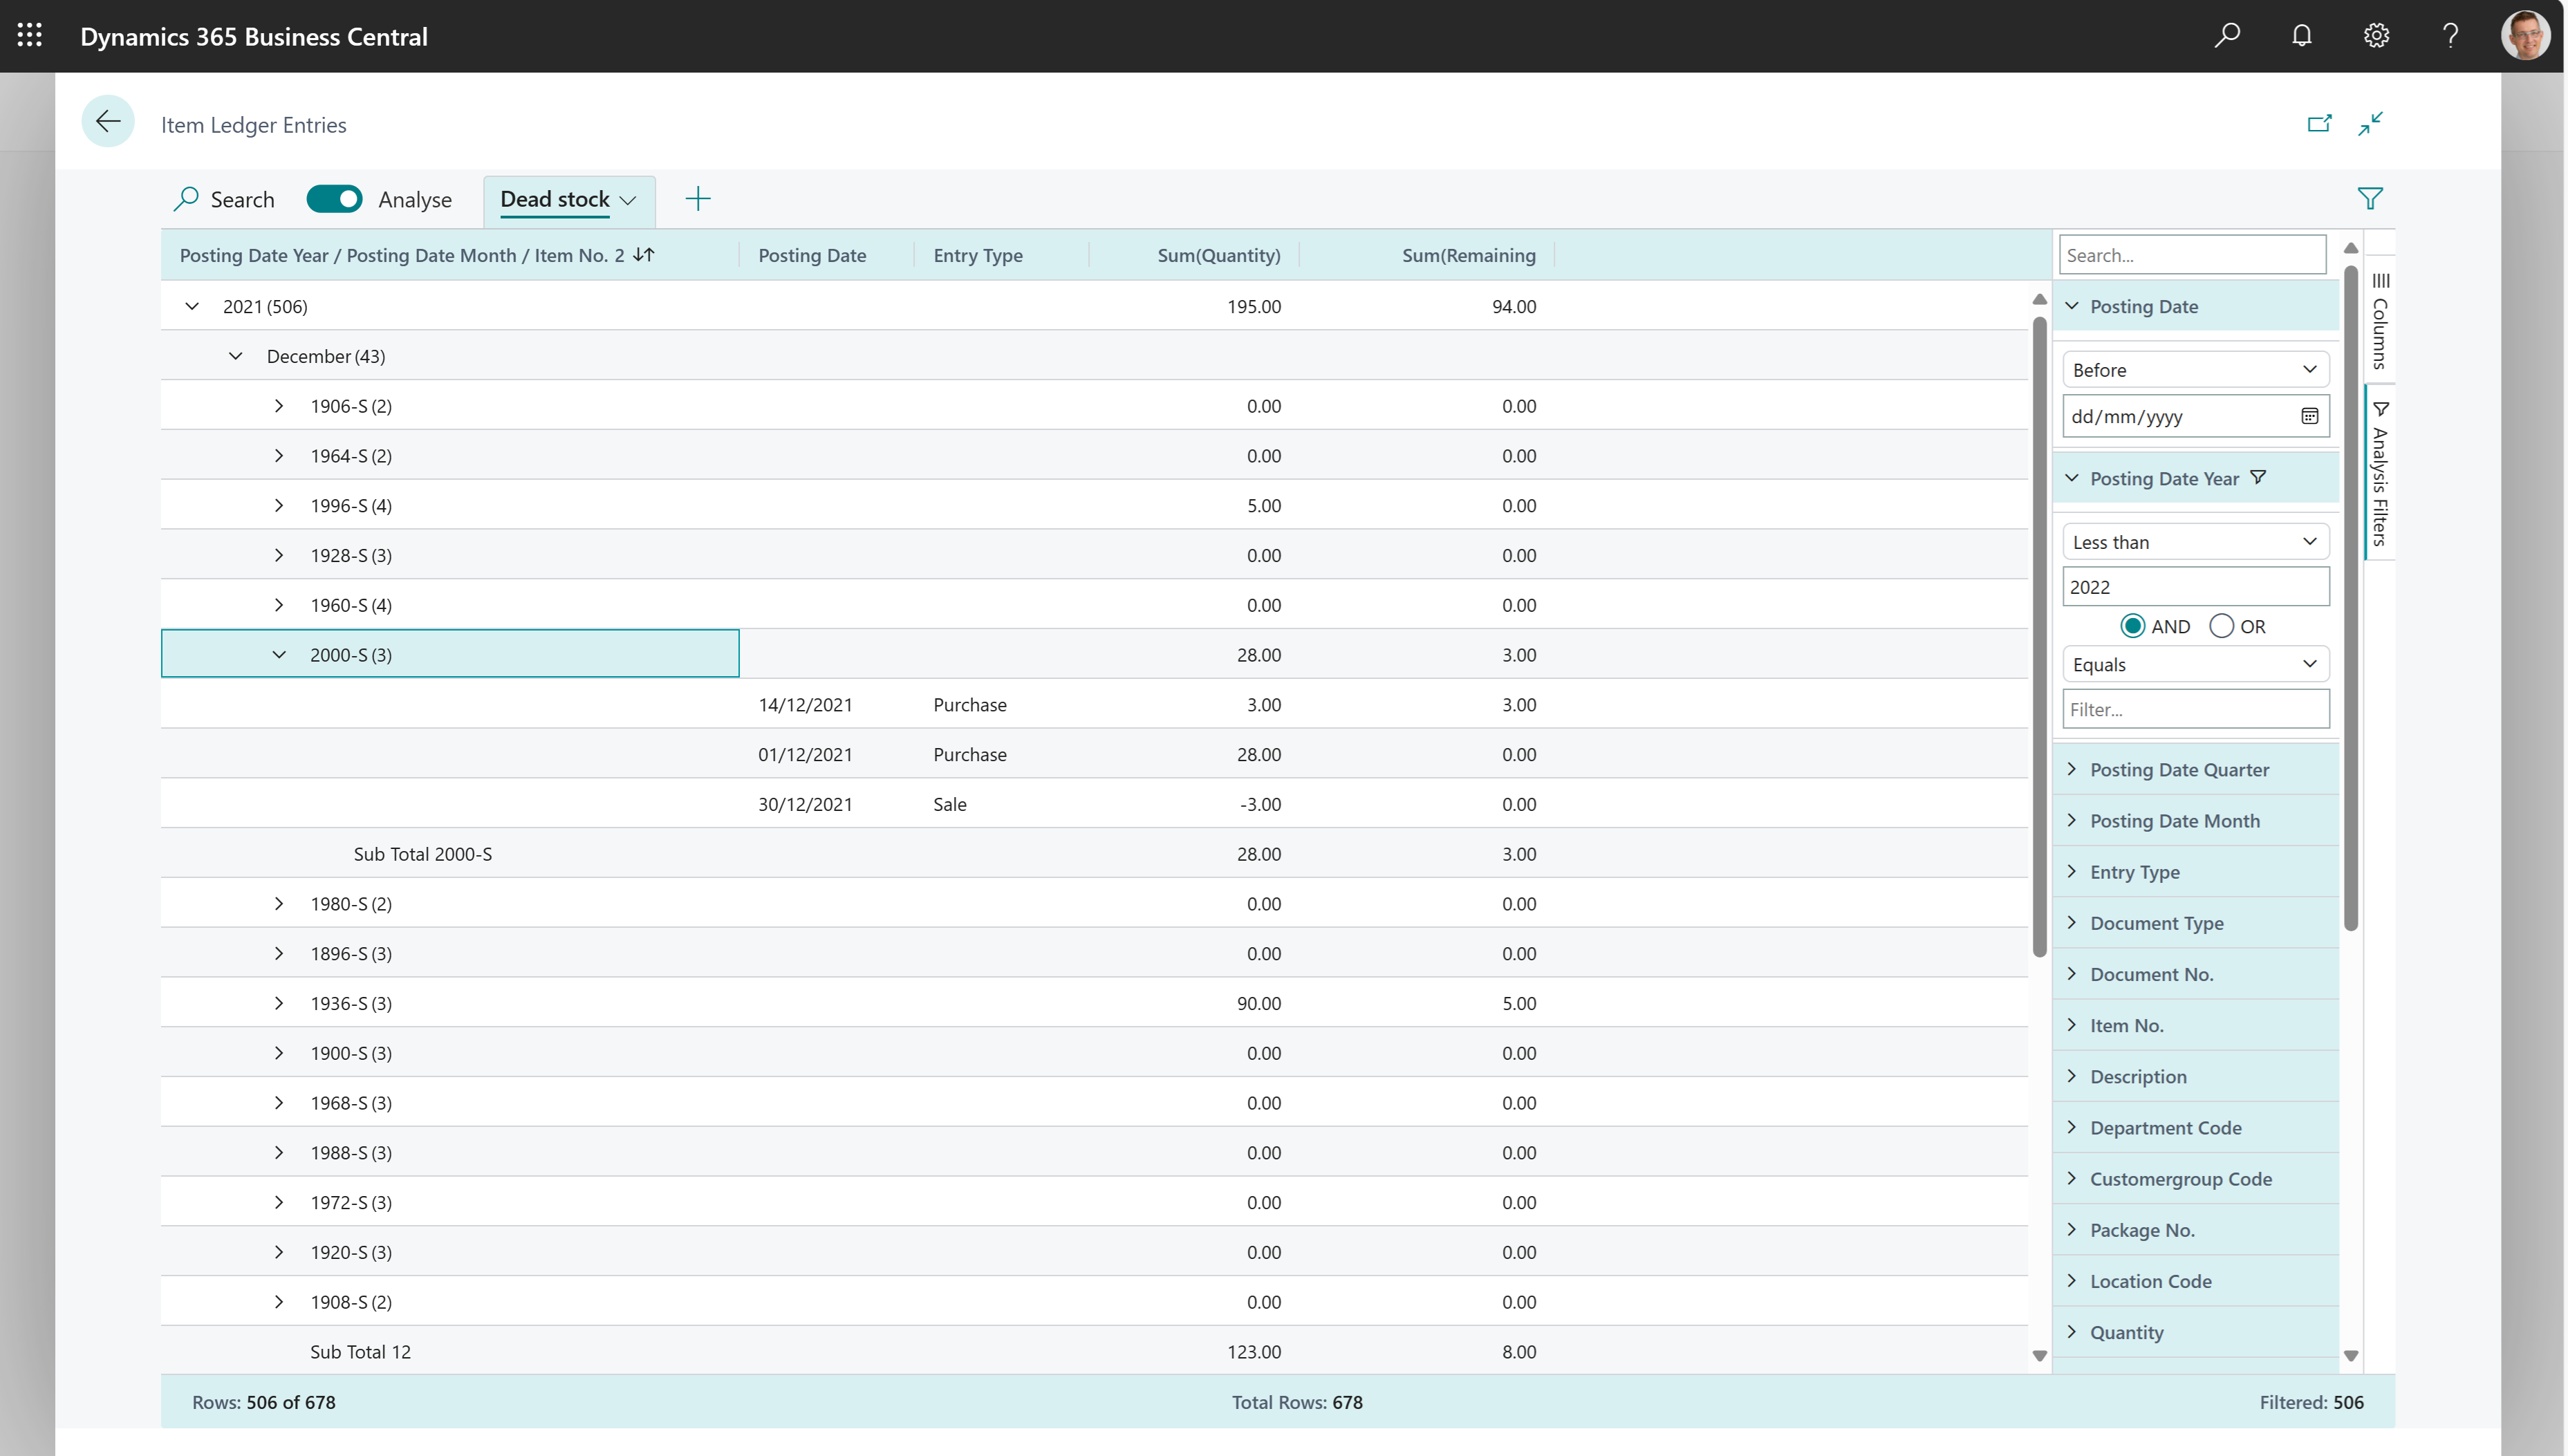
The Data Analysis feature lets you open almost any list page, such as Item Ledger Entries, enter analysis mode, and then group, filter, and pivot data as you see fit.
Similarly, you can use the Open in Excel action to open a list page, optionally filter the list to a subset of the data, and then use Excel to work with the data. For example, by using features such as Analyze Data, What-If Analysis, or Forecast Sheet.
Tip
Tip:
If you configure OneDrive for system features, the Excel workbook opens in your browser.
To learn more about how to do ad-hoc analysis on inventory data, go to Ad hoc analysis of inventory data.
Built-in reports for inventory
Business Central includes several built-in reports, tracing functions, and tools to help inventory organizations report on their data.
To get an overview of the reports that are available for inventory, choose All Reports on your Home page. This action opens the Role Explorer, which is filtered to the features in the Report & Analysis option. Under the Warehouse heading, choose Explore.
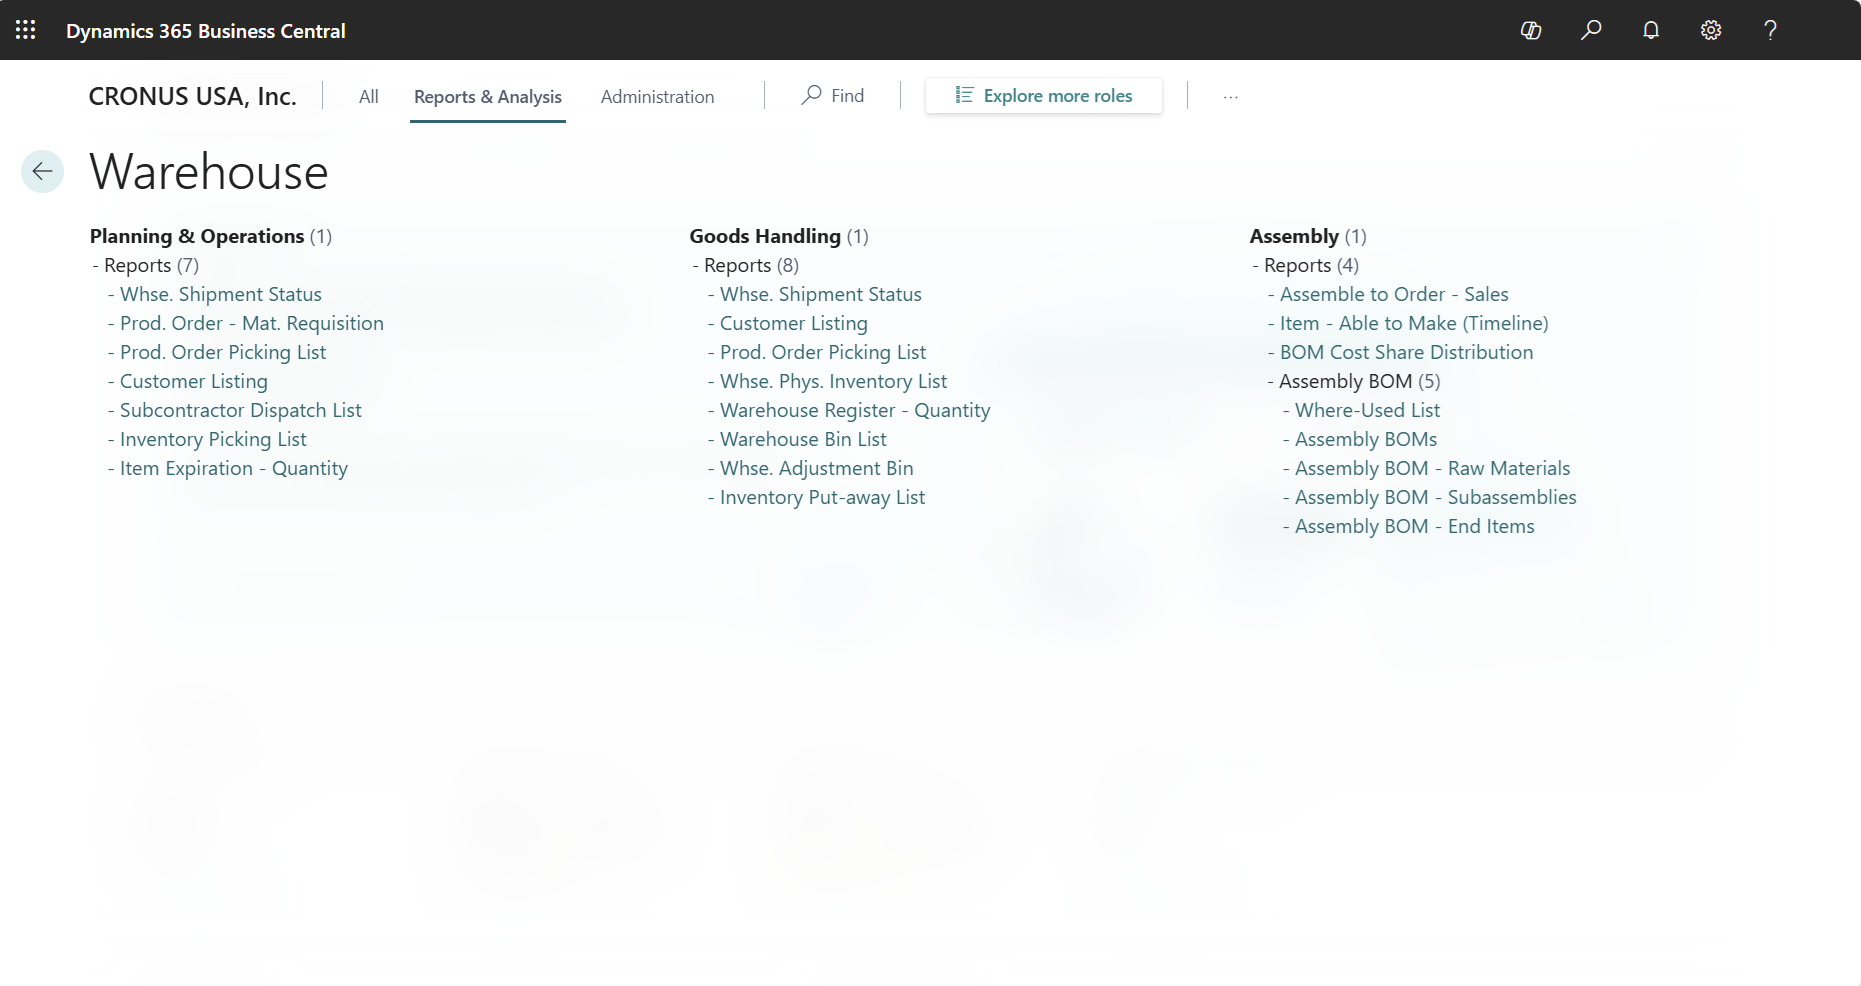
To learn more, go to Finding Reports with the Role Explorer.
To learn more about reports that are relevant for inventory, go to Built-in inventory and warehouse reports.
On-screen inventory analytics
Business Central has several pages that give you inventory overviews and tasks to do. Here are some examples to get you started:
- View the Availability of Items
- Track items with serial, lot, and package numbers
- Trace item-tracked items
- Audit the reconciliation between the inventory ledger and the general ledger
- View cross-docked items in a shipment or pick worksheet
The sales module also include analytics pages related to inventory:
Show inventory-related general ledger entries and balances from the Chart of Accounts page
The Chart of Accounts page shows all general ledger accounts with aggregated numbers posted to the general ledger. From this page, you can do things like:
- View reports that show general ledger entries and balances.
- Review a list of posting groups for that account.
- View separate debit and credit balances for a single account.
Specifically for inventory management, you can create a view on the Chart of Accounts page that only shows the accounts you use to post inventory entries.
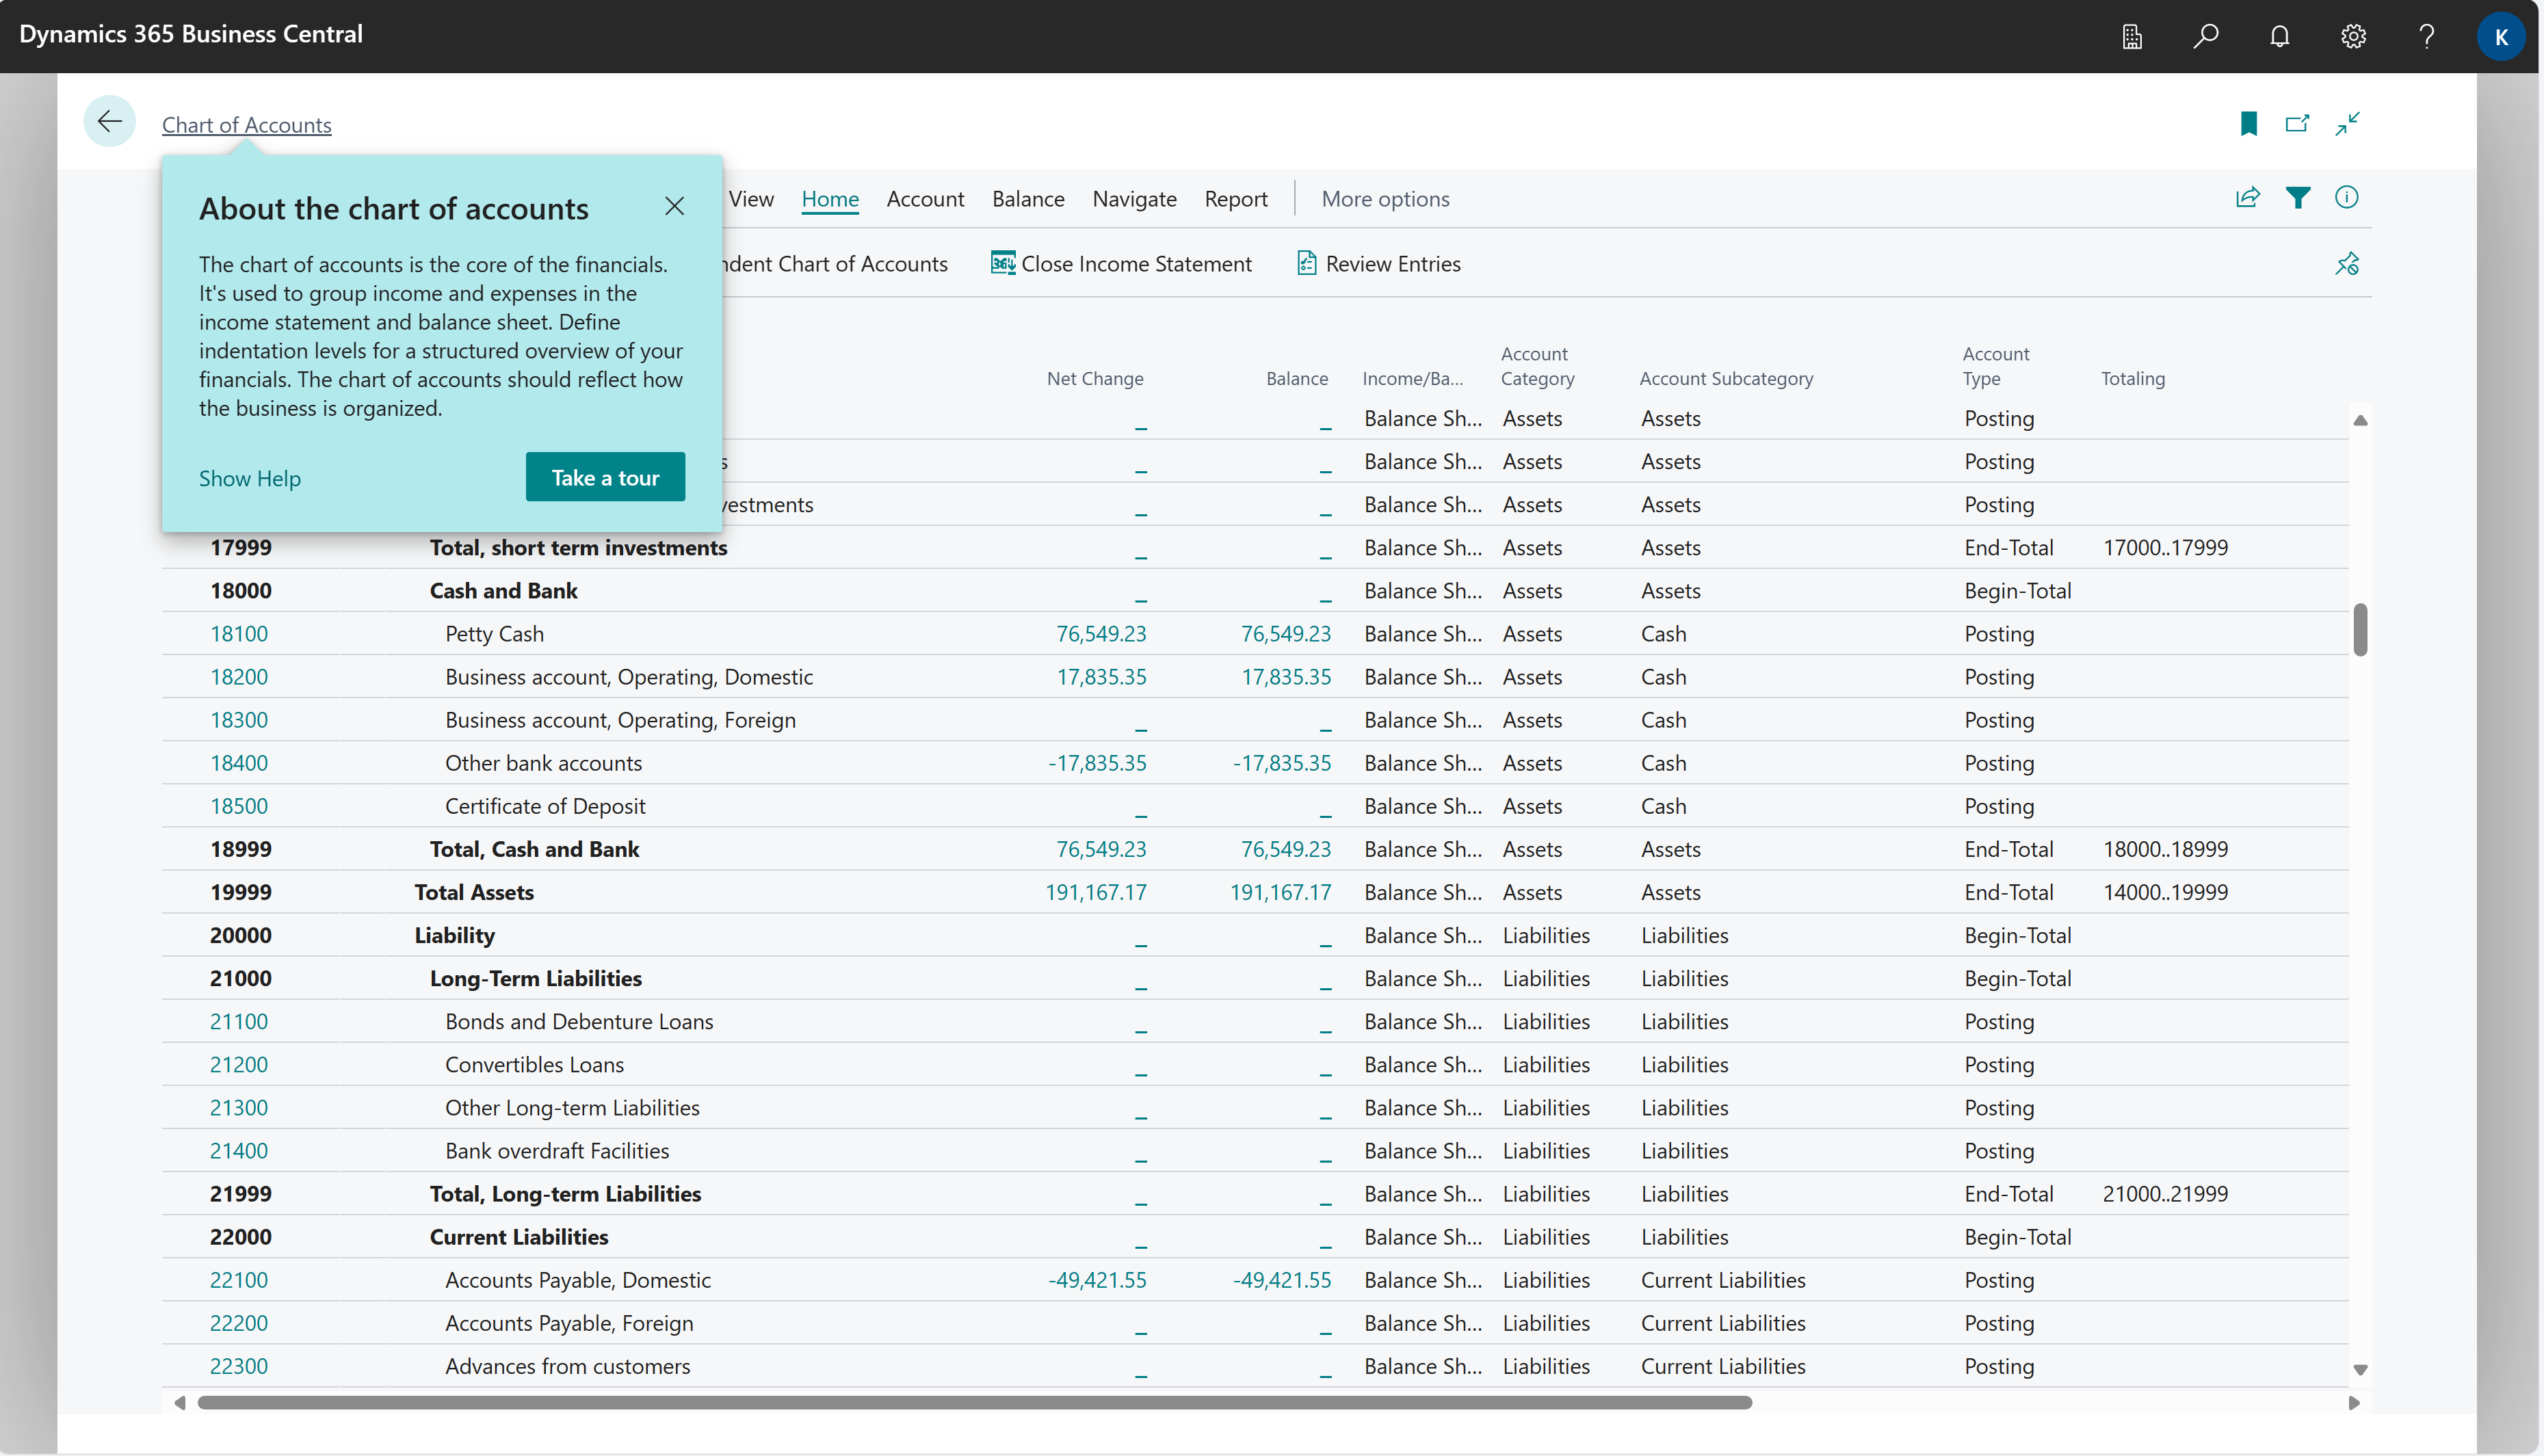
To learn more, go to Understand the Chart of Accounts.
Analyze inventory data by dimensions
Dimensions are values that categorize entries so you can track and analyze them on documents, such as sales orders. Dimensions can, for example, indicate the project or department an entry came from.
So, instead of setting up separate general ledger accounts for each department or location, you can use dimensions as a basis for analysis and avoid having to create a complicated chart of accounts structure.
To learn more, go to Analyze Data by Dimensions.
See also
Company consolidation
Power BI Inventory app
Power BI Inventory Valuation app
Prepare Financial Reports with Financial Data and Account Categories
Handling finance reporting across business units or legal entities
Ad-hoc analysis of inventory data
Built-in inventory and warehouse reports
Understand the Chart of Accounts
Analyze Data by Dimensions
Analytics, business intelligence, and reporting overview
Work with Business Central