Prepare financial reporting with financial data and account categories
The Financial Reports feature gives you insights into the financial data shown on your chart of accounts (COA). You can set up financial reports to analyze figures in general ledger (G/L) accounts, and compare general ledger entries with budget entries. The results display in charts and reports in your Role Center, such as the Cash Flow chart, and the built-in Income Statement and Balance Sheet reports. You access these two reports, for example, with the Financial Statements action in the Business Manager and Accountant home pages.
Business Central provides sample financial reports you can use right away as templates. You can also set up your own reports to specify the figures to compare. For example, you can create financial reports to calculate profit margins using dimensions such as departments or customer groups. The number of financial reports you can create is unlimited and require no involvement of a developer.
Prerequisites for financial reporting
Setting up financial reports requires an understanding of the structure of your chart of accounts. There are three key concepts that you likely need to pay attention to before you design your financial reports:
- Map G/L posting accounts to G/L account categories.
- Design how you use dimensions.
- Set up G/L budgets.
G/L account categories simplify your financial report definitions and make them more resilient to changes in the chart of accounts structure. Learn more at Use G/L account categories to change the layout of your financial statements.
Setting up dimensions allows you to slice and dice your financial data in ways that make sense for your organization. Learn more at Work with Dimensions.
If you want to view general ledger entries as percentages of budget entries, you must create G/L budgets. Learn more at Create G/L Budgets.
Report selection for built-in finance reports
Business Central provides built-in Balance Sheet, Income Statement, Cash Flow, and Retained Earnings reports. The Financial Reporting feature defines the data and layouts for these reports. You can replace the standard layouts provided in Business Central with your own. Learn more at Report selection for finance reports.
Financial reports
Financial reports arrange accounts from your chart of accounts in ways that make data easier to present. You can set up various layouts to define the information you want to extract from the chart of accounts. Financial reports also provide a place for calculations that can't be made directly in the chart of accounts. For example, you can create subtotals for groups of accounts and then include that total in other totals. Another example is to calculate profit margins on dimensions such as departments or customer groups. Additionally, you can filter general ledger entries and budget entries, for example, by net change or debit amount.
Note
Note:
Mathematically, think of a financial report as defined by two things:
- A vector of row definitions that define what needs to be calculated.
- A vector of column definitions that defines the data for the calculation.
The financial report is then the outer product of these two vectors. The value in each cell is calculated by applying the formula in the row applied to the data definition from the column.

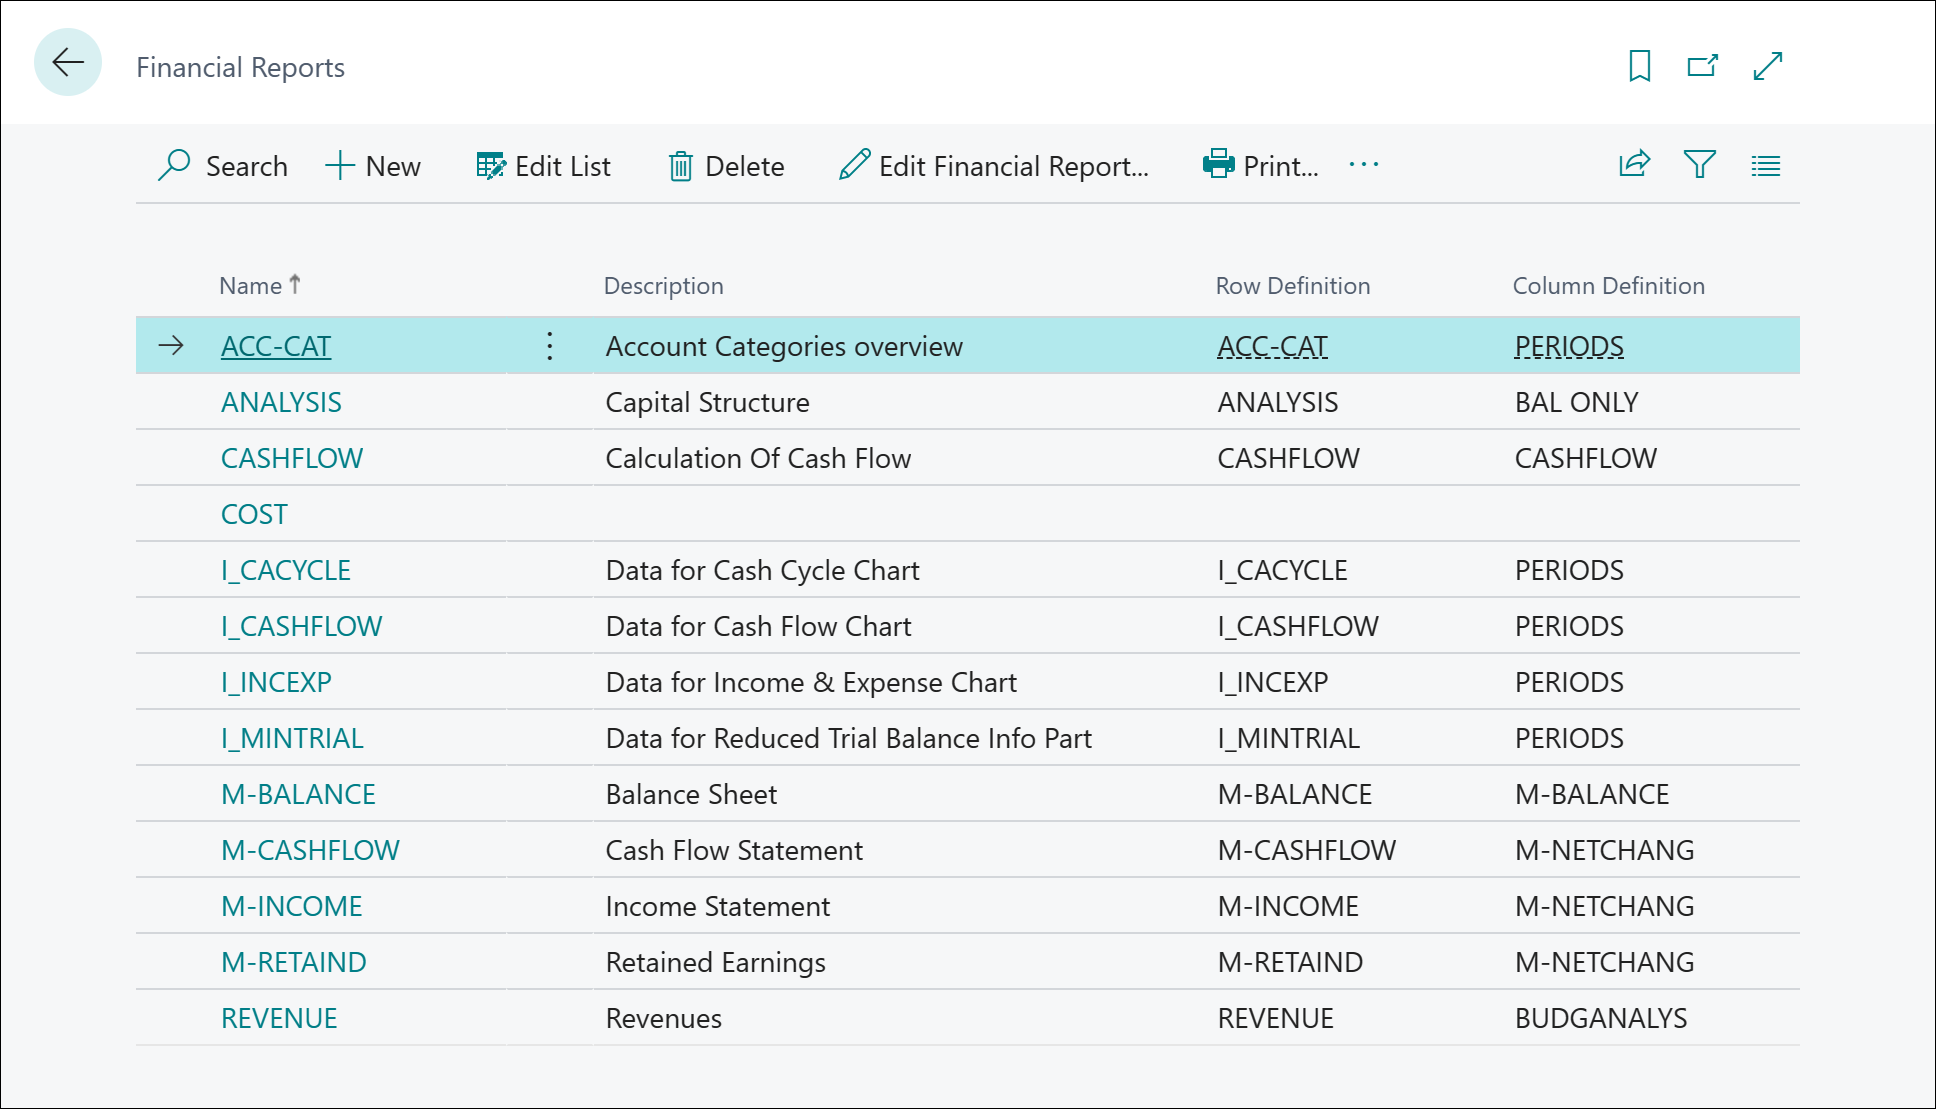
The Financial Reports page shows how all financial reports follow a pattern that consists of the following attributes:
- Name (code)
- Description
- Row definition
- Column definition
- Internal description (introduced in 2025 release wave 1)
Note
Note:
The sample finance reports in Business Central aren't ready to use out of the box. Depending on how you set up your G/L accounts, dimensions, G/L account categories, and budgets, you need to adjust the sample row and column definitions and the finance reports they're used in to match your setup.
You can also use formulas to compare two or more financial reports and column definitions. Comparisons let can do the following things:
- Create customized financial reports.
- Create as many financial reports as you need, each with a unique name.
- Set up various report layouts and print the reports with the current figures.
To learn more about comparisons, go to When to use a comparison period formula and comparison date formula in a column definition.
Learning path: Create financial reports in Microsoft Dynamics 365 Business Central
Want to learn how to create budgets and use financial reports, dimensions, and row and column definitions to generate financial reports that businesses often need?
Start on the following learning path Create financial reports in Microsoft Dynamics 365 Business Central.
Create a financial report
You use financial reports to analyze general ledger accounts or to compare general ledger entries with budget entries. For example, you can view the general ledger entries as percentages of the budget entries.
The financial reports in the standard version of Business Central might not suit your business needs. To quickly create your own financial reports, start by copying an existing one, as described in step 3 below.
Choose the
 icon, enter Financial Reports, then choose the related link.
On the Financial Reports page, choose the New action to create a financial report name. Alternatively, to reuse settings from an existing financial report, choose the report, and then choose the Copy Report Definition action.
In the Name field, enter a short name for the report
Note
Note:
You can't change the name later.In the Display Title field, enter a description of the report.
Choose a row definition and a column definition.
Optionally, choose analysis views for the row and column definitions.
Choose the View Financial Report action to access more properties on the financial report.
On the Options FastTab, you can edit the report title, change the row and column definitions, write an internal description, set the formatting for negative numbers, and define how to show dates. Dates can be a Day/Week/Month/Quarter/Year hierarchy, or use accounting periods. To learn more, go to Comparing accounting periods using period formulas.
On the Dimensions FastTab, you can define dimension filters for the report.
If you want the report output to include an introductory and/or a closing paragraph, add them from the Definitions menu (these fields are available from the 2025 release wave 1 and later).
You can now preview the report in the area below the Dimensions FastTab.
Note
Note:
When you open a financial report in View or Edit mode, the Filter pane is available. Don't use the Filter pane to set filters for the data in your report. Such filters can cause errors or might not actually filter the data. Instead, use the fields on the Options and Dimensions FastTabs to set up filters for the report.
Adding introductory and/or closing paragraphs
INTRODUCED IN: Business Central 2025 release wave 1.
If you want the report output to include an introductory and/or a closing paragraph, you can use the Edit introductory/closing paragraphs action on the Definitions menu. When you export the report to PDF or Excel, these paragraphs display before and after the report body.
Choosing a format for negative numbers
INTRODUCED IN: Business Central 2025 release wave 1.
If you want to control how negative numbers show in the report output (both on-screen and in PDF), you use the Negative Amount Format action on the Options FastTab to choose your preferred format. The format can be a minus sign or parentheses.
Show amounts in an additional currency (ACY)
Your general ledger is set up to use your local currency (LCY), but you can set it up to also use another currency with a current exchange rate assigned. If you designate a second currency as an additional reporting currency (ACY), Business Central automatically records amounts in both LCY and ACY on each G/L entry.
Financial reports are based on G/L entries. To display report data in the additional reporting currency, select the Show Amounts in Add. Reporting Currency checkbox on the Options FastTab for the relevant report.
Tip
Tip:
You can report on both LCY and ACY in the same report. To learn more, go to Create reports that include both local currency and additional currency.
Note
Note:
The Show Amounts in Add. Reporting Currency checkbox is only available if you set up an ACY. To learn more, go to Set Up an Additional Reporting Currency.
Create or edit a row definition
Row definitions in financial reports provide a place for calculations that can't be made directly in the chart of accounts. For example, you can create subtotals for groups of accounts and then include that total in other totals. You can also calculate intermediate steps that aren't shown in the final report.
Row definitions also provide settings for formatting your report. Most of the options provide visual definition to reports when people view or preview them on their monitors, or print them.
Note
Note:
Some of the formatting options don't carry over when you export them to Excel. If you often export reports to Excel, you might skip the formatting here and format the report in Excel instead.
To learn more, go to Row definitions in financial reporting.
Create or edit a column definition
Use column definitions to specify the columns to include in the report. For example, you can design a report layout to compare net change and balance for the same period this year and last year. You can have up to 15 columns in a column definition. For example, multiple columns are useful for displaying budgets for 12 months with a column that shows the total.
To learn more, go to Column definitions in financial reporting.
Using dimensions in financial reports
In financial analysis, a dimension is data you add to an entry as a kind of marker. This data is used to group entries with similar characteristics, such as customers, regions, products, and salesperson, and easily retrieve these groups for analysis. You can use dimensions on entries in journals, documents, and budgets.
Each dimension describes the focus of analysis. So, a two-dimensional analysis, for example, would be sales per area. By using more than two dimensions when you create an entry, you can carry out a more complex analysis. An example of a complex analysis is exploring sales per sales campaign per customer group per area. That gives you greater insight into your business, such as how well your business is operating, where it is or isn't thriving, and where you should allocate more resources. That insight helps you make more informed business decisions. To learn more, go to Work with Dimensions.
Set up financial reports with overviews
You can use a financial report to create a statement that compares general ledger figures with budget figures.
Choose the
icon, enter Financial Reports, then choose the related link.On the Financial Reports page, select a financial report.
Choose the Edit Row Definition action
On the Row Definition page, in the Name field, select the default financial report name.
Choose the Insert G/L Accounts action.
Select the accounts you want to include in your statement, then choose OK.
The accounts are inserted in your financial report. If you want, you can also change the column definition.
Choose the Edit Financial Report action.
On the Financial Report page, on the Dimensions FastTab, set the budget filter to the filter name you want to use.
Choose OK.
Now you can copy and paste your budget statement into a spreadsheet.
Best practices for working with financial report definitions
Financial report definitions aren't versioned. When you change a report definition, the old version is replaced when your change saves to the database. The following list contains some best practices for working with financial report definitions:
- If you add report definitions, choose a good code and fill in the description field with a meaningful text while you still know what you use the report for. This information helps your coworkers (and your future self) to work with the report and perhaps changing the report definition.
- Before you change a report definition, consider taking a copy of it as a backup, just in case your change doesn't work as expected. You can either just copy the definition (give it a good name), or export it. To learn more, go to Import or export financial report definitions.
- If you need a fresh copy of a definition that Business Central provides, an easy way to get one is to create a company that only contains setup data. Then, export the definition and import it in the company where the definition needs a refresh.
Import or export financial report definitions
You can import and export financial report definitions as RapidStart configuration packages. For example, configuration packages are useful for sharing information with other companies. The package is created in a .rapidstart file, which compresses the contents.
Note
Note:
When you import financial report definitions, the new definitions replace existing records with the same names. The configuration package for a report definition won't overwrite any existing row or column definitions that the report definition uses.
To import or export financial report definitions, follow these steps:
- Choose the icon, enter Financial Reports, then choose the related link.
- Choose the financial report, then choose the Import Financial Report or Export Financial Report action, depending on what you want to do.
To learn more about how to import or export financial report row or column definitions, go to the following articles:
- Import or export financial reporting row definitions, or
- Import or export financial reporting column definitions
Integrate financial reports with Excel
You can integrate a financial report with an Excel workbook template, adjust the layout to suit your needs, and then update the Excel template with data from Business Central. For example, this integration makes it easier to generate your monthly and yearly financial statements in a format that works for you.
To learn more, go to How to integrate financial reports with Excel.
Print and save financial reports
You can print financial reports using your device's printing services. Business Central also offers options to save reports as PDF files.
To learn more, go to How to print and save financial reports.
Related information
View a financial report
Row definitions in financial reporting
Column definitions in financial reporting
Financial Reporting Auditing
The General Ledger and the Chart of Accounts
Financial analytics overview
Finance
Setting Up Finance
Work with Business Central