Inventory Valuation by Location (Power BI Report)
APPLIES TO: Generally available in Business Central 2024 release wave 2.
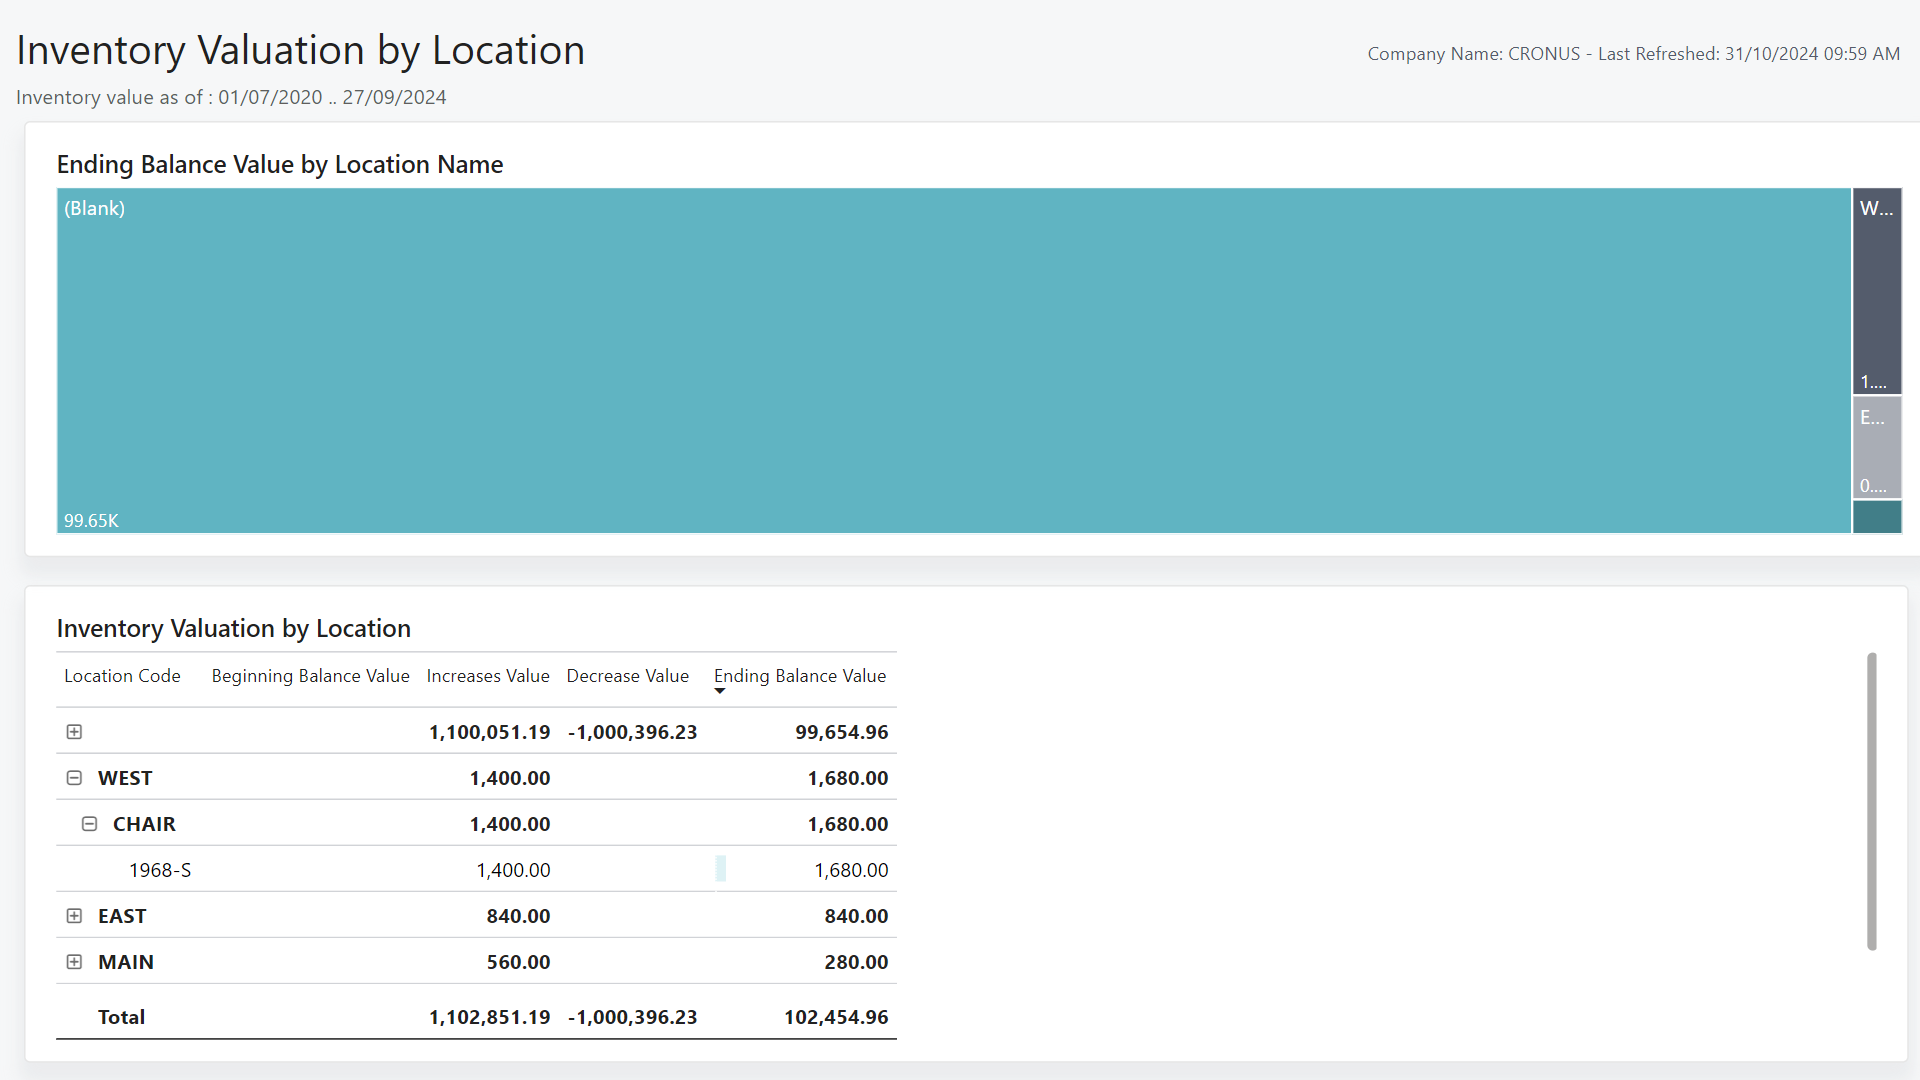
The Inventory Valuation by Location report shows item values on a location by location basis for an organization. Use this report to identify high-value locations.
The report focuses on the value of each location, and shows the following information for a period you specify:
- Beginning balance value
- Increases and decreases
- End balance value
Use the report
The report is designed to help executives and managers to identify high-value locations.
Executives use this report to get an overall understanding of your organizations inventory and its value. This information can help you make informed strategic decisions for managing inventory, supplier relationships, and forecasts.
Managers use the report to monitor the value of on-hand inventory. This information can keep you informed about increases and decreases in the value of your stock over time.
Key Performance Indicators (KPIs)
The Inventory Valuation by Location report includes the following KPIs:
Click on the link for a KPI to learn more about what it means, how it is calculated, and what data was used in the calculations.
Tip
Tip:
You can easily track the KPIs that the Power BI reports display against your business objectives. To learn more, go to Track your business KPIs with Power BI metrics.
Data used in the Inventory Valuation by Location report
The report uses data from the following tables in Business Central:
- Location
- Value Entries
Try the report
Try the report here: Inventory Valuation by Location
Tip
Tip:
If you hold down the CTRL key while you select the report link, the report opens on a new browser tab. In this way, you can stay on the current page while you explore the report on the other browser tab.
Related information
Track KPIs with Power BI metrics
Power BI Inventory Valuation app
Ad hoc analysis of inventory data
Built-in inventory and warehouse reports
Inventory analytics overview
Inventory overview