Inventory Overview (Power BI Report)
APPLIES TO: Generally available in Business Central 2024 release wave 2.
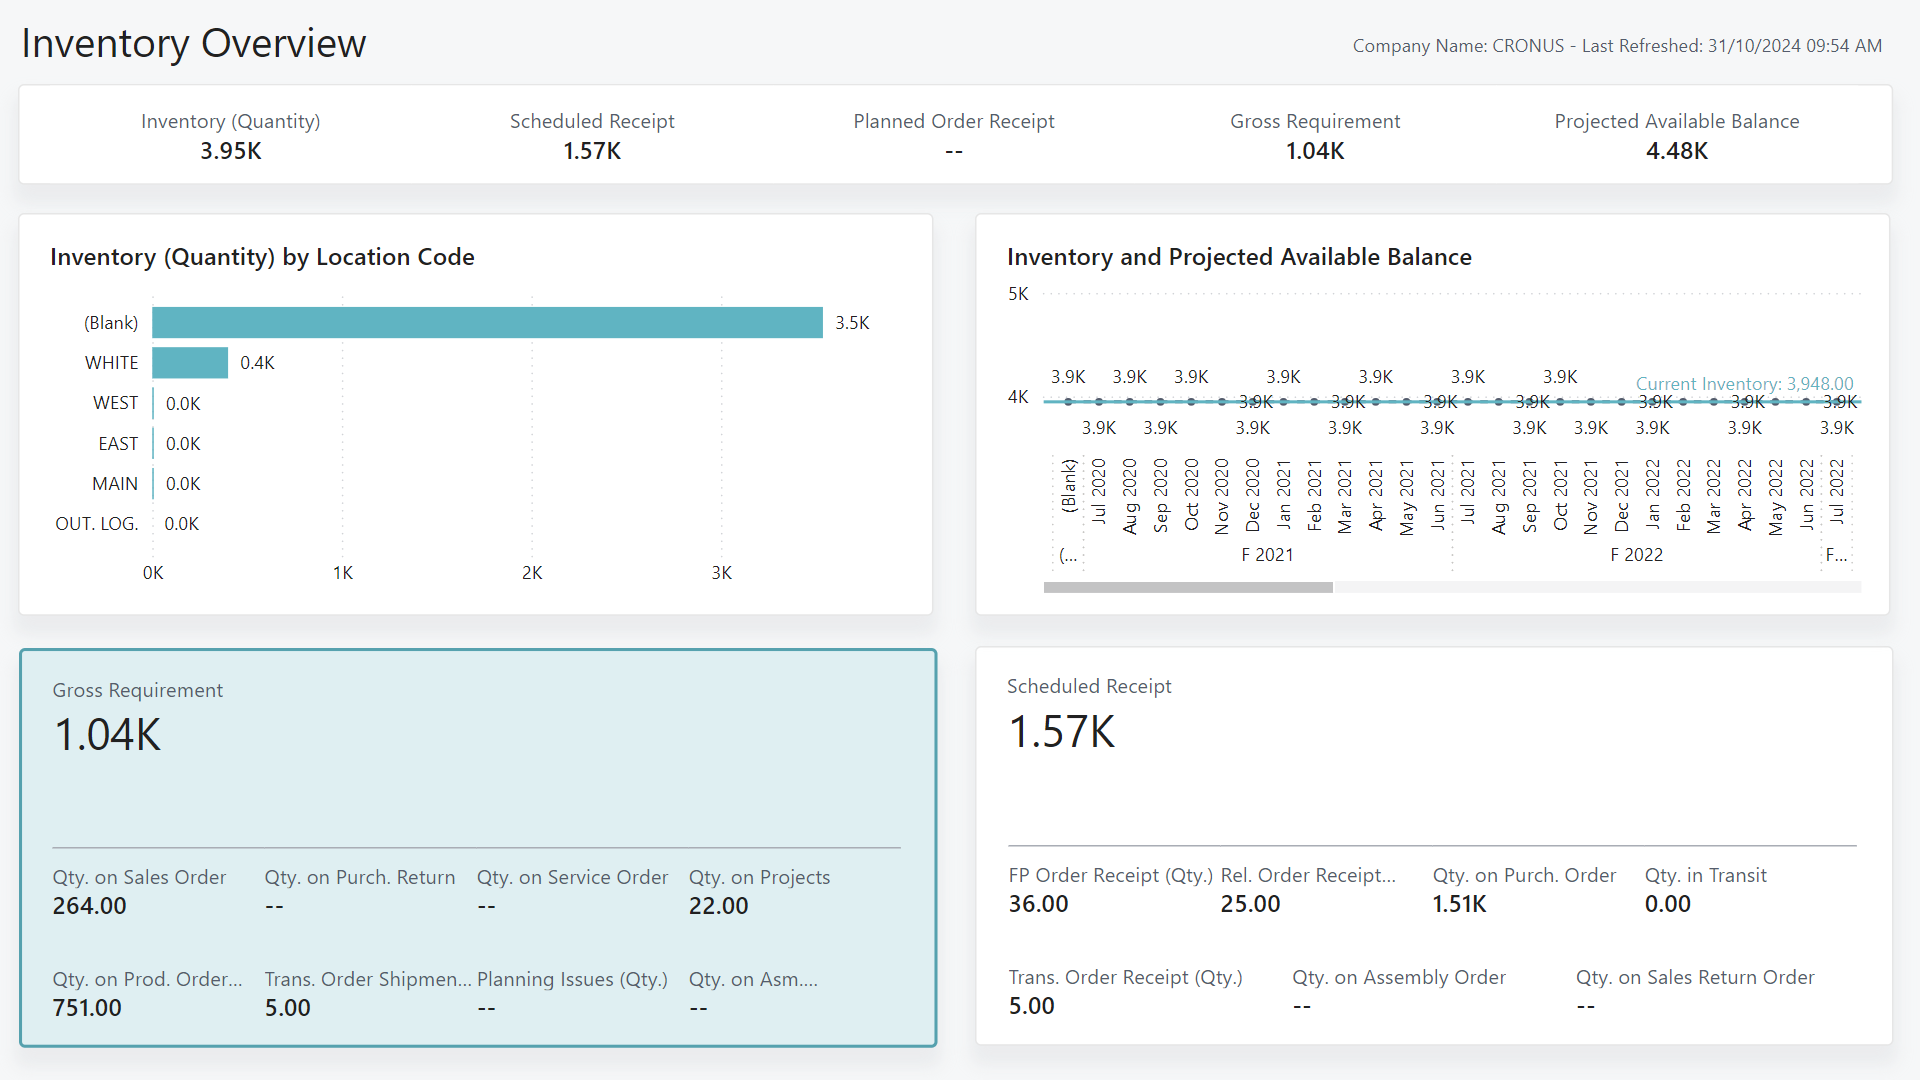
The Inventory Overview report provides a high-level summary of your inventory. It shows key metrics, such as:
- Inventory (Quantity)
- Scheduled receipts
- Gross requirements
- Project available balance
The report can give you a high-level understanding of your inventory on a location by location basis, along with quantities across different types of documents.
Use the report
Leadership and management can gauge inventory levels across locations and get an idea about requirements versus receipts.
Management teams use the report to paint a picture of the stock information without having to drill down. The report gives a clear view of stock you're receiving and the demand that's currently in the system.
Key Performance Indicators (KPIs)
The Inventory Overview report includes the following KPIs:
- Inventory (Quantity)
- Scheduled Receipt
- Planned Order Receipt
- Gross Requirement
- Projected Available Balance
- Qty. on Sales Order
- Qty. on Purch. Return
- Qty. on Service Order
- Qty. on Projects
- Qty. on Prod. Order Comp Lines
- Trans Order Shipment
- Planning Issues
- Qty. on Asm. Component
- FP Order Receipt (Qty.)
- Rel. Order Receipt (Qty.)
- Qty. on Purch. Order
- Qty. in Transit
- Trans. Order Receipt (Qty.)
- Qty. on Assembly Order
- Qty. on Sales Return Order
Click on the link for a KPI to learn more about what it means, how it is calculated, and what data was used in the calculations.
Tip
Tip:
You can easily track the KPIs that the Power BI reports display against your business objectives. To learn more, go to Track your business KPIs with Power BI metrics.
Data used in the report
The report uses data from the following tables in Business Central:
- Item
- Item Ledger Entries
- Job Planning Lines
- Purchase Lines
- Sales Lines
- Service Lines
- Assembly Header
- Assembly Lines
- Planning Component Lines
- Prod Order Component Lines
- Transfer Lines
Try the report
Try the report here: Inventory Overview
Tip
Tip:
If you hold down the CTRL key while you select the report link, the report opens on a new browser tab. In this way, you can stay on the current page while you explore the report on the other browser tab.
Related information
Track KPIs with Power BI metrics
Power BI Inventory app
Ad hoc analysis of inventory data
Built-in inventory and warehouse reports
Inventory analytics overview
Inventory overview