Analytics in purchasing
Businesses capture lots of data during daily activities that supports business intelligence (BI) for purchasing managers:
- Purchase quotes
- Purchase orders
- Purchase invoices
Business Central provides features to help you gather, analyze, and share your organization's purchasing data:
- Power BI reports for purchasing
- Ad-hoc analysis on lists
- Ad-hoc analysis of data in Excel (using open in Excel)
- Built-in sales reports
Each of these features has advantages and disadvantages, depending on the type of data analysis and the role of the user. To learn more, go to Analytics, business intelligence, and reporting overview.
This article introduces how you can use these analytical features to gain purchasing insights.
Analytics needs in purchasing
When you think about the analytics needs in purchasing, it might help to use a persona-based model that describes different analytics needs at a high-level.

People in different roles have different needs when it comes to data, and they use the data in different ways. For example, people in asset management and finance interact with data differently than people in sales.

| Role | Data aggregation | Typical ways to consume data |
|---|---|---|
| COO / CSO / CFO / CEO | Performance data | KPIs Dashboards Financial reports |
| Purchasing Manager | Trends, summaries | Built-in managerial reports Ad-hoc analysis |
| Purchasing Officer / Purchasing Agent | Detailed data | Built-in operational reports On-screen task data |
Using Power BI to monitor purchasing KPIs
A key performance indicator (KPI) is a measurable value that shows how effectively you’re meeting your goals. In procurement, people often use the following KPIs to monitor their procurement organization's performance:
- Outstanding Amount (excluding VAT)
- Amount Received but Not Invoiced (excluding VAT)
- Period-over-Period Purchases Growth (Amount or in percentage)
- Purchases by Item/Vendor/Location/Purchaser
- Actual purchases vs Budget
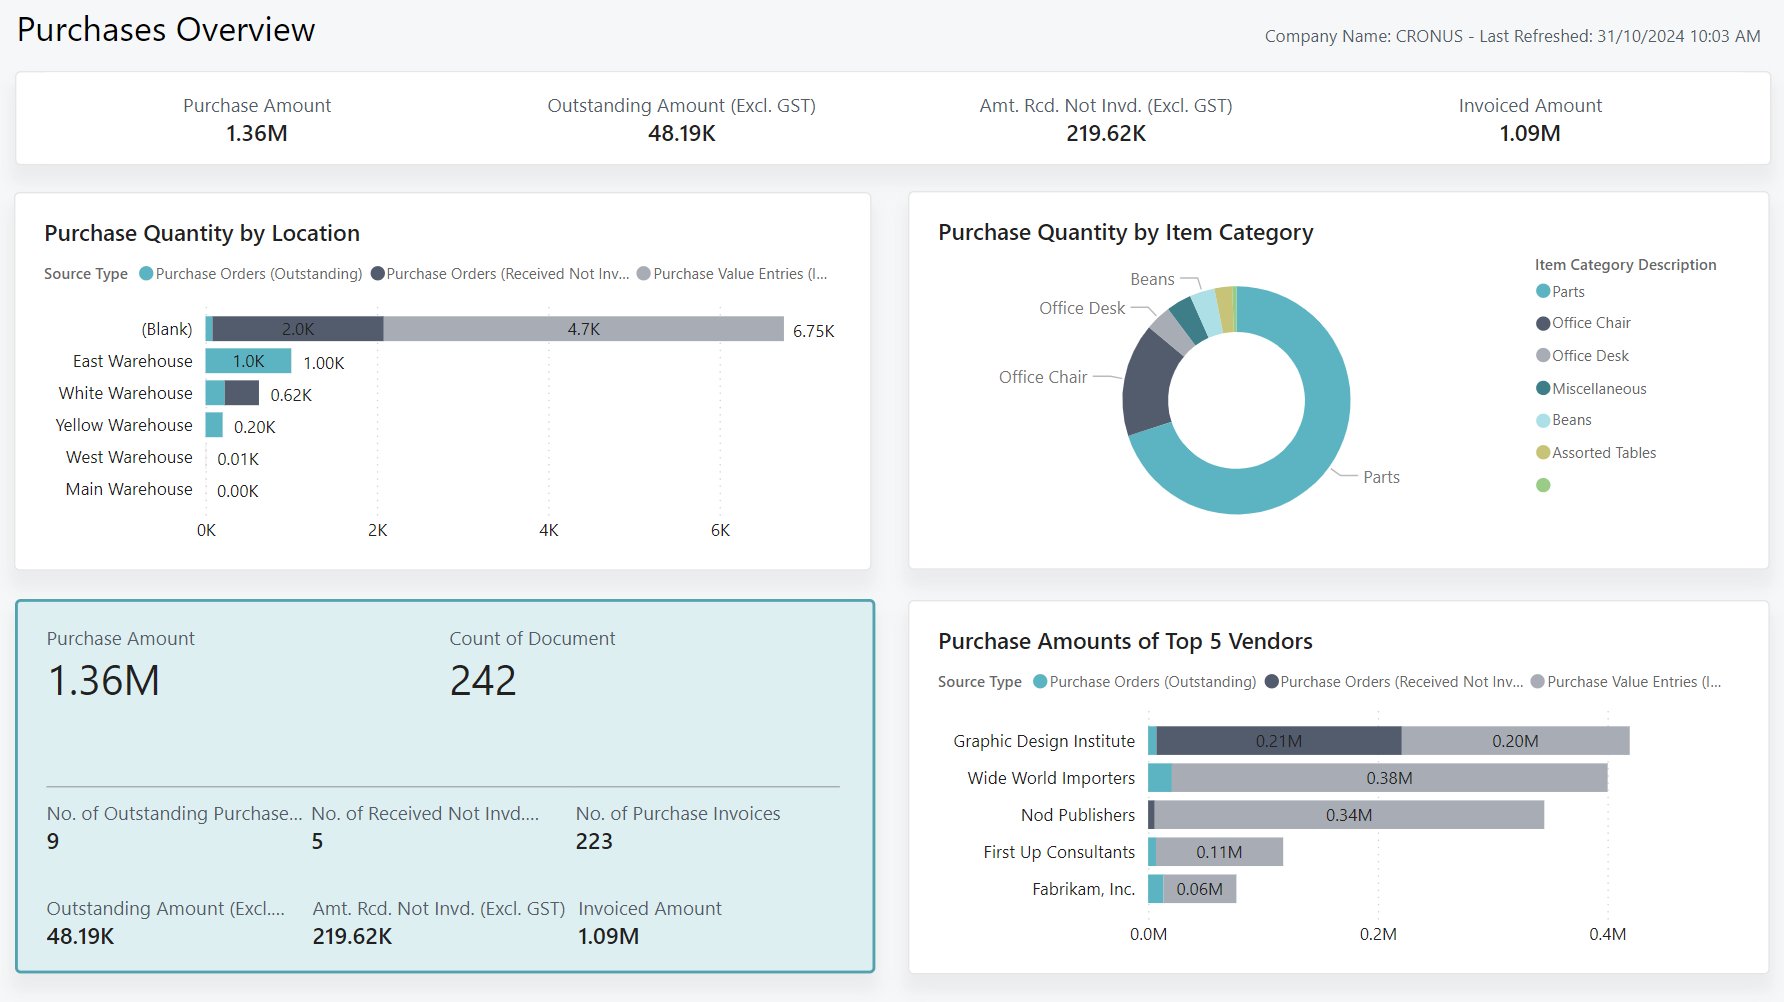
These purchasing KPIs, and more, are available in the Power BI Purchasing app for Business Central. To learn more, go to Power BI Purchasing app.
The following table describes how you can use the reports in the Power BI Purchasing app.
| To... | Open in Business Central (CTRL+select) | Learn more |
|---|---|---|
| Get a high-level summary of all purchasing activities. View purchase statistics such as summaries of amounts, outstanding amounts, amounts received but not invoiced, and invoiced amounts. | Purchases Overview | About Purchases Overview |
| Explore the costs of various components on purchases with a detailed breakdown of your purchasing data by categories, vendors, fiscal month, year, and document types. | Purchase Decomposition | About Purchases Decomposition |
| Analyze daily purchasing activities and highlight trends and exceptions in daily spend. Monitor day-to-day purchase fluctuations and identify unusual spending patterns. | Daily Purchases | About Daily Purchases |
| Analyze the 30-day moving average of your purchases, compare it to the total purchase amount, and identify purchasing trends and patterns. | Moving Averages | About Moving Averages |
| Get an overview of the total of all purchases over a rolling 12-month period for long-term trend analysis and forecasting. | Moving Annual Total | About Moving Annual Total |
| Compare your purchasing data across different time periods. You can compare at the year, quarter, or month levels, and identify how purchases track across these periods. | Period-Over-Period | About Period-Over-Period |
| Gain insights into your purchasing performance over time. Identify trends or patterns that emerge over time. | Year-Over-Year | About Year-Over-Year |
| Analyze purchasing activities by vendor by item to gain a better understanding of the items that consume a significant portion of your purchasing budget. | Purchases by Item | About Purchases by Item |
| Analyze purchasing activities by vendor to identify which vendors are responsible for most of your purchasing activity. | Purchases by Vendor | About Purchases by Vendor |
| Analyze purchasing activities by purchaser to manage your purchasing teams and individual performance. | Purchases by Purchaser | About Purchases by Purchaser |
| Gain a comprehensive view of your purchase data across different warehouse locations, and identify trends and patterns in their purchasing activities. | Purchases by Location | About Purchases by Location |
| Compare actual spending to allocated budget to ensure that spending aligns with financial plans. | Actual vs Budget | About Actual vs. Budget |
| Analyze high level information on return orders and view key metrics such as the purchase amount, purchase quantity, and return rate. | Purchase Return Overview | About Purchase Return Overview |
| Analyze high level information on purchase quote activities. Identify purchase figures related to purchase amounts or quantity for prospective vendors. | Purchase Quote Overview | About Purchase Quote Overview |
| Analyze the key factors that drive purchasing activities. Find the most impactful variables and trends. | Key Purchase Influencers | About Key Purchase Influencers |
| Analyze the forecasted purchase amount to gain projected purchasing insights across vendor, purchaser and item. | Purchase Forecasting | About Purchase Forecasting |
| Analyze vendor performance across key purchase metrics. Insights include return rate, discount amount, item and spend reliance. | Vendor Quality Analysis | Vendor Quality Analysis |
Tip
Tip:
You can easily track the KPIs that the Power BI reports display against your business objectives. To learn more, go to Track your business KPIs with Power BI metrics.
Use financial reporting to produce financial statements and KPIs (related to purchasing)
The Financial Reporting feature gives you insights into the financial data shown on your chart of accounts (COA). You can set up financial reports to analyze figures in general ledger (G/L) accounts, and compare general ledger entries with budget entries. Specifically for purchasing, you can set up financial reports on the general ledger (G/L) accounts that you use to track purchase postings.
Dimensions play an important role in business intelligence. A dimension is data that you can add to an entry as a parameter. Dimensions let you group entries that have similar characteristics, such as customers, regions, and products, and easily retrieve these groups for analysis. Among other purposes, use dimensions when you define analysis views and create financial reports. To learn more, go to Work with Dimensions.
To learn more about financial reports, go to Prepare Financial Reports with Financial Data and Account Categories.
Finance reporting across business units or legal entities (related to purchasing)
Some organizations use Business Central in multiple business units or legal entities. Others use Business Central in subsidiaries that report to parent organizations. Business Central gives accountants tools that help them transfer general ledger entries from two or more companies (subsidiaries) into a consolidated company. Specifically for purchasing management, you might want to consolidate general ledger entries for your purchasing accounts to track sales KPIs across business units or legal entities.
To learn more, go to Company consolidation.
Ad-hoc analysis of purchasing data
Sometimes, you just need to check whether the numbers add up correctly, or quickly confirm a figure. The following features are great for ad-hoc analyses:
- Data analysis on ledger list pages
- Open in Excel
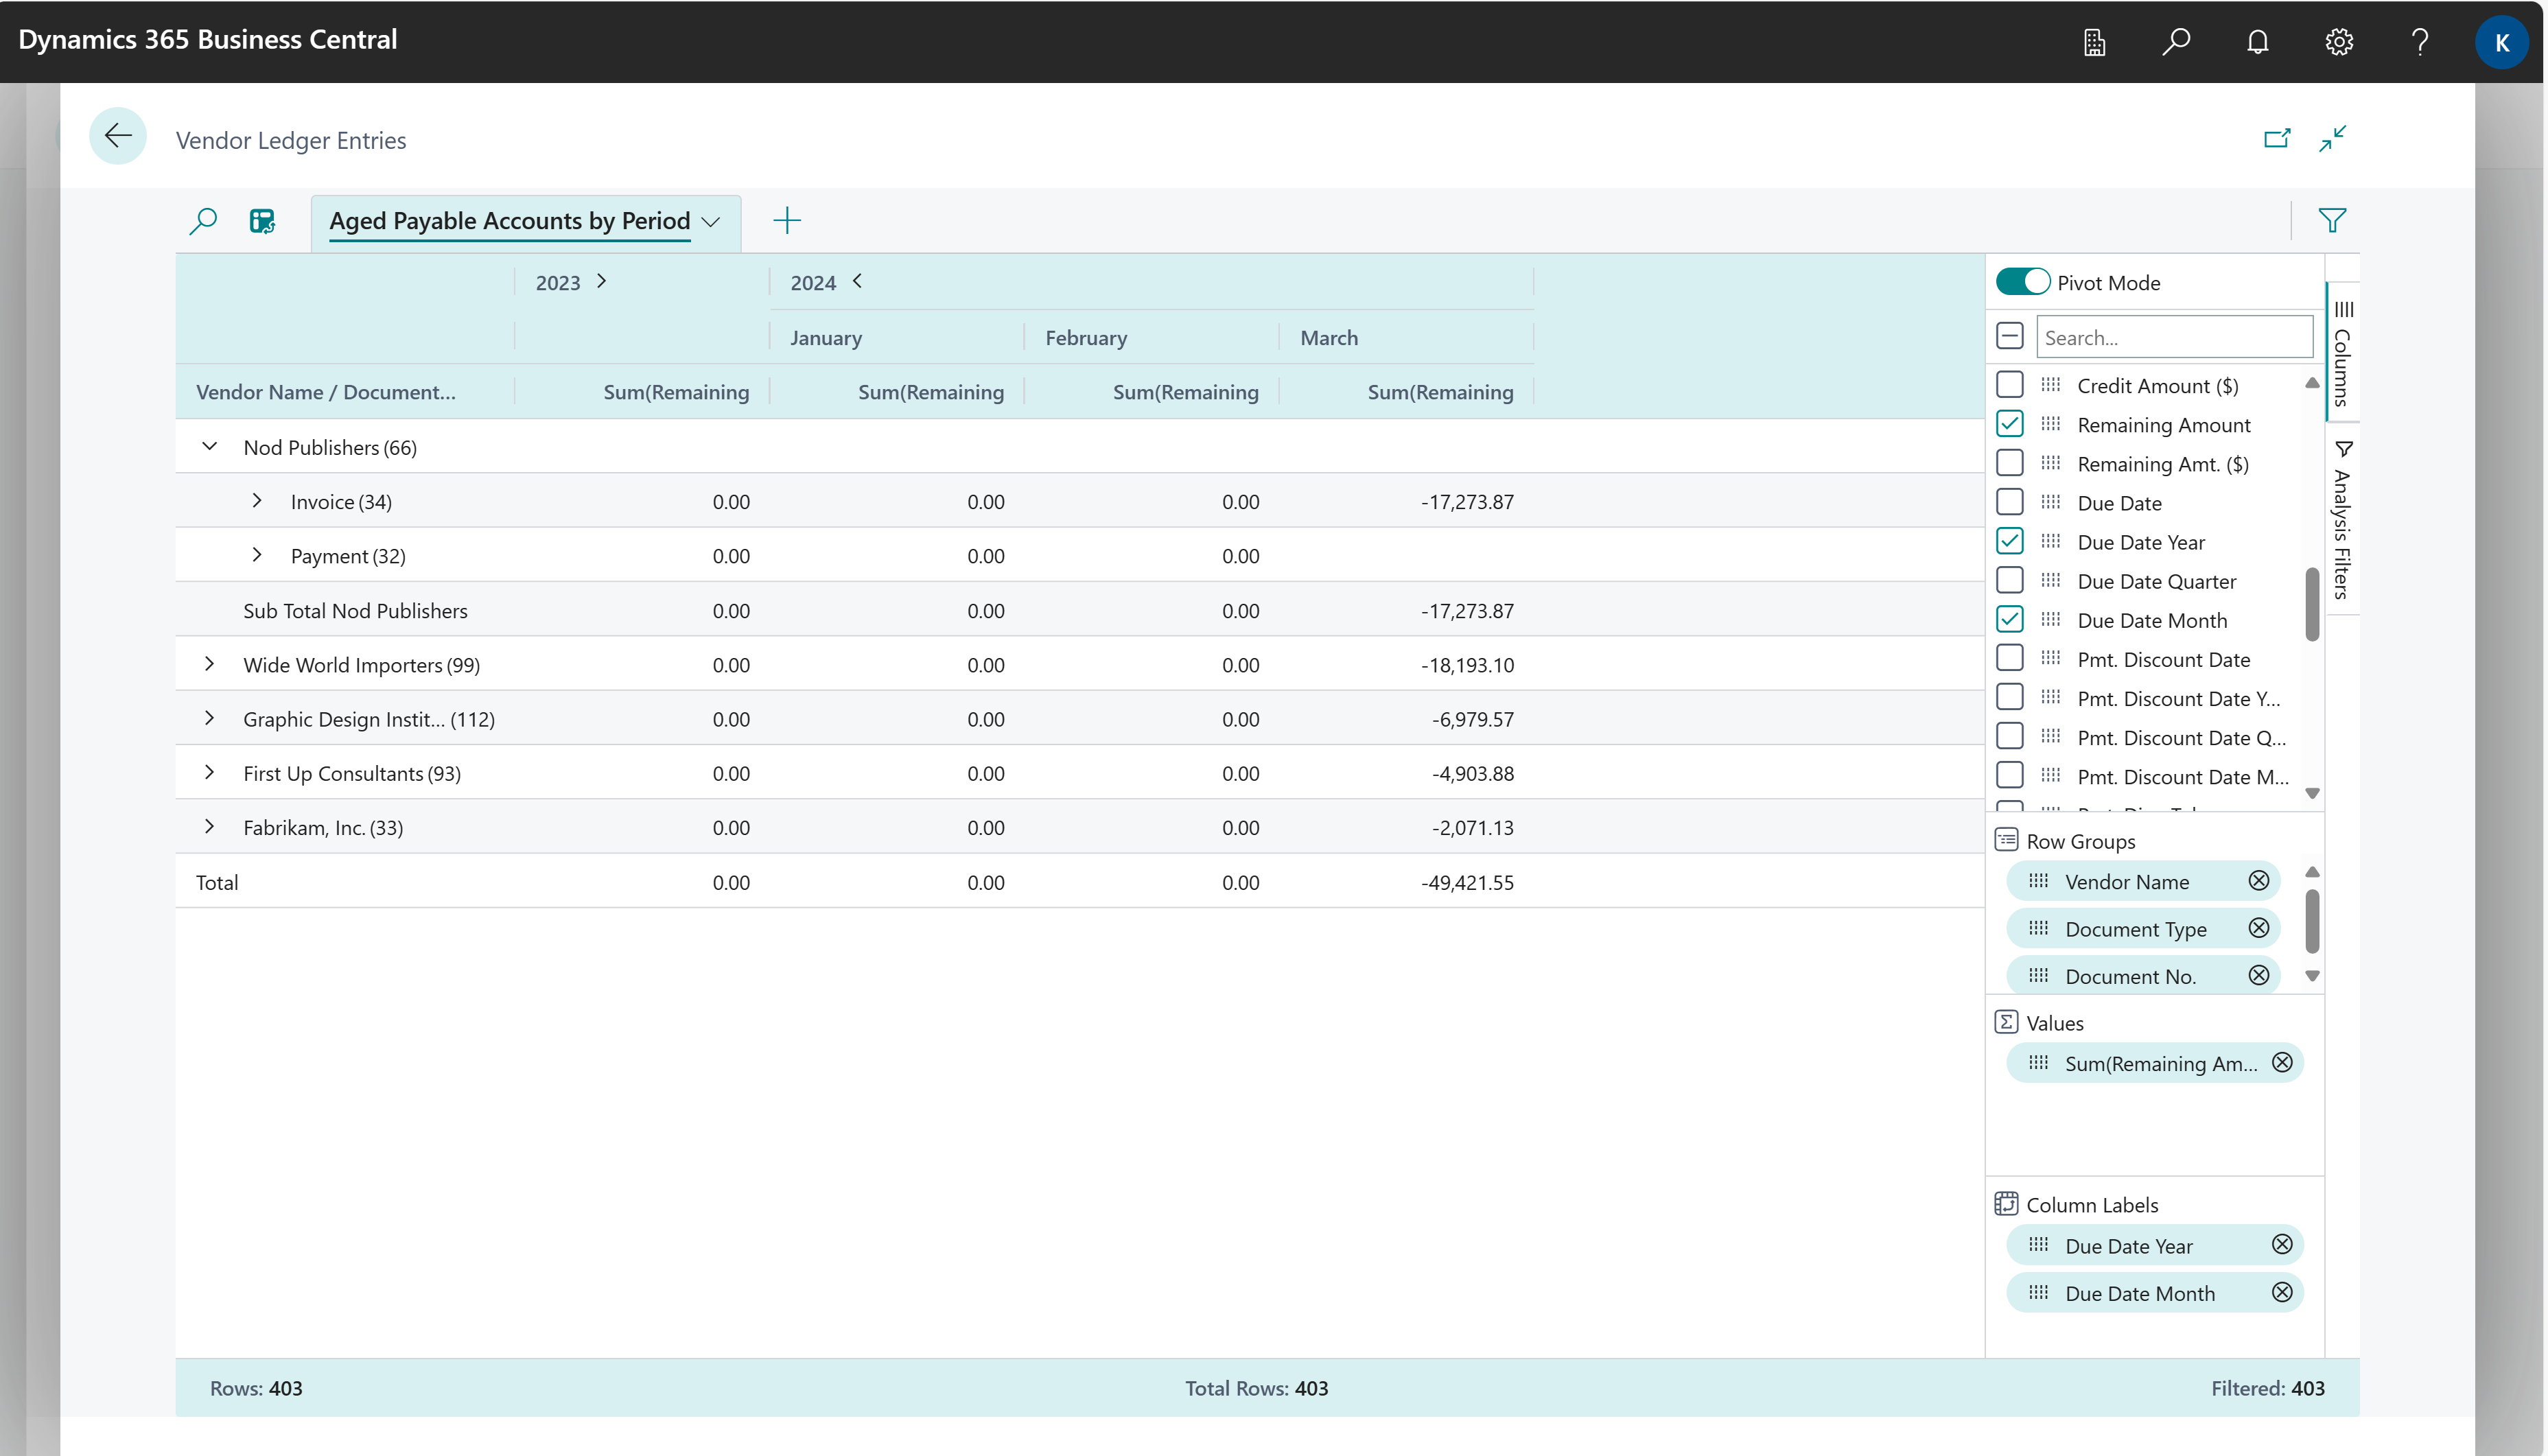
The Data Analysis feature lets you open almost any list page, such as Purchase Orders, Posted Purchase Invoices, Vendor Ledger Entries, or General Ledger Entries, enter analysis mode, and then group, filter, and pivot data as you see fit.
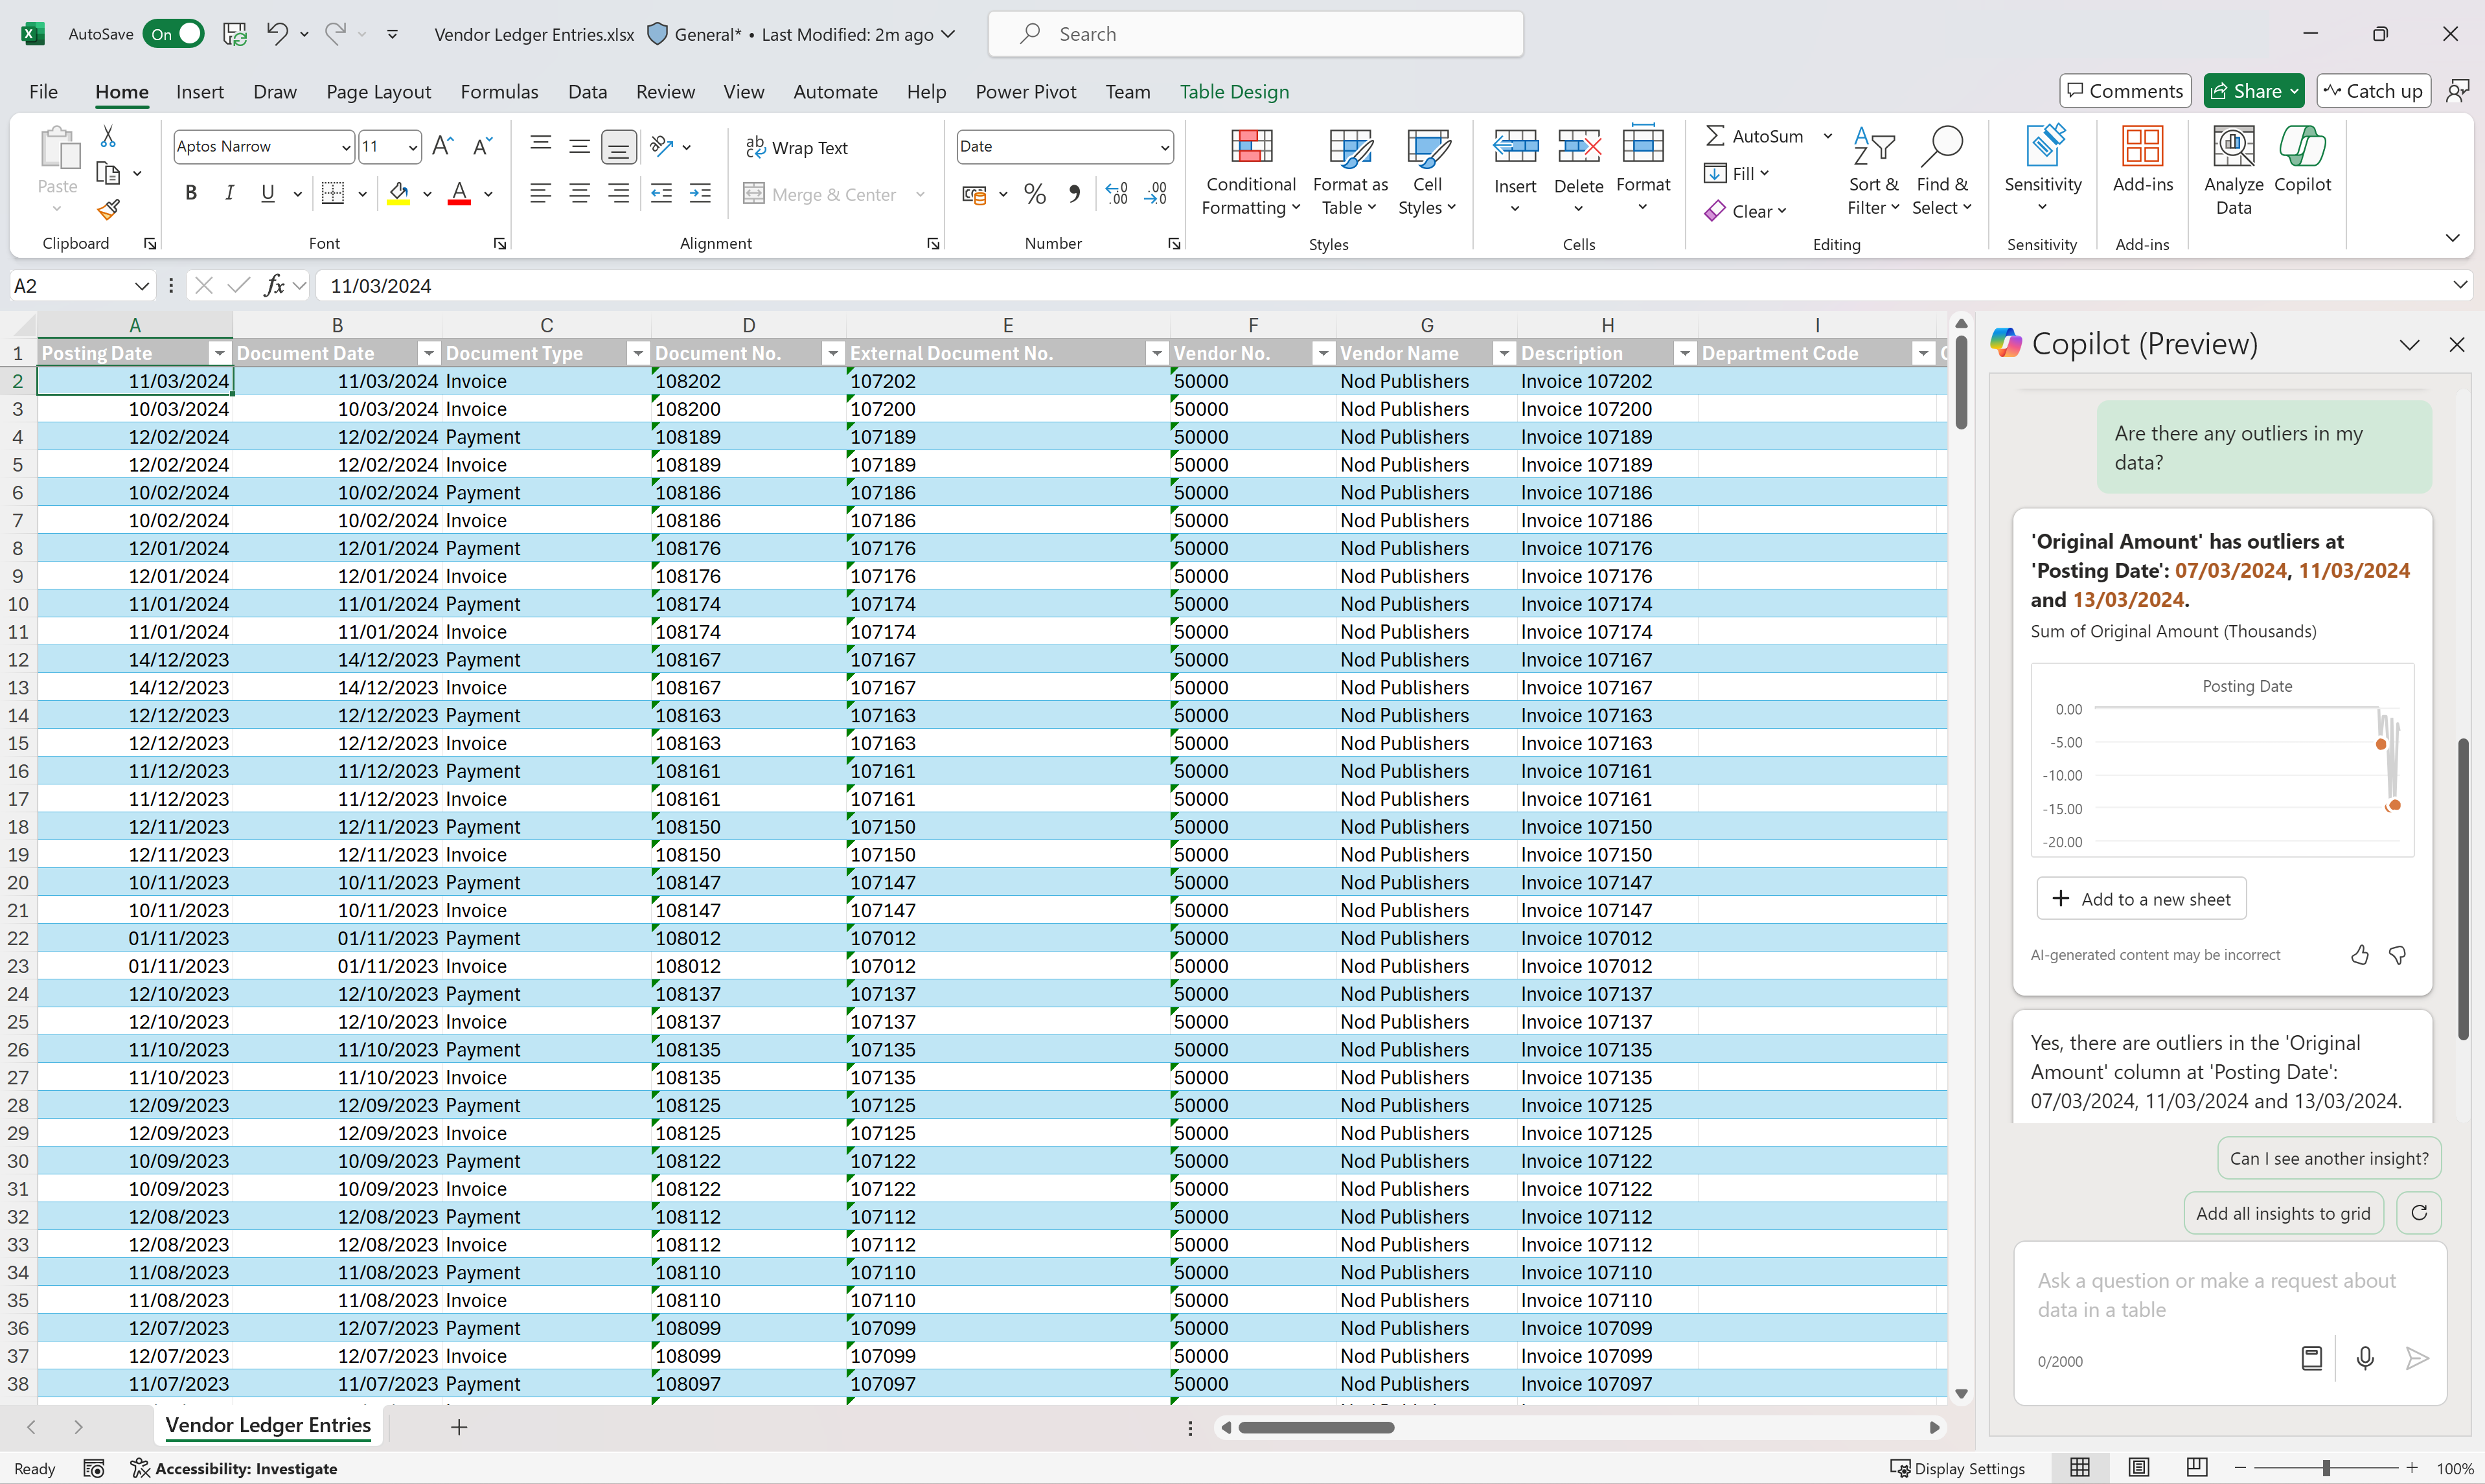
Similarly, you can use the Open in Excel action to open a list page, filter the list to a subset of the data, and then use Excel to work with the data. For example, by using features such as Analyze Data, What-If Analysis, or Forecast Sheet.
Tip
Tip:
If you configure OneDrive for system features, the Excel workbook opens in your browser.
To learn more about how to do ad-hoc analysis on purchasing data, go to Ad hoc analysis of purchasing data.
Built-in reports for purchasing
Business Central includes several built-in reports, tracing functions, and tools to help purchasing organizations report on their data.
To get an overview of the reports that are available for purchasing, choose All Reports on your Home page. This action opens the Role Explorer, which is filtered to the features in the Report & Analysis option. Under the Purchasing heading, choose Explore.
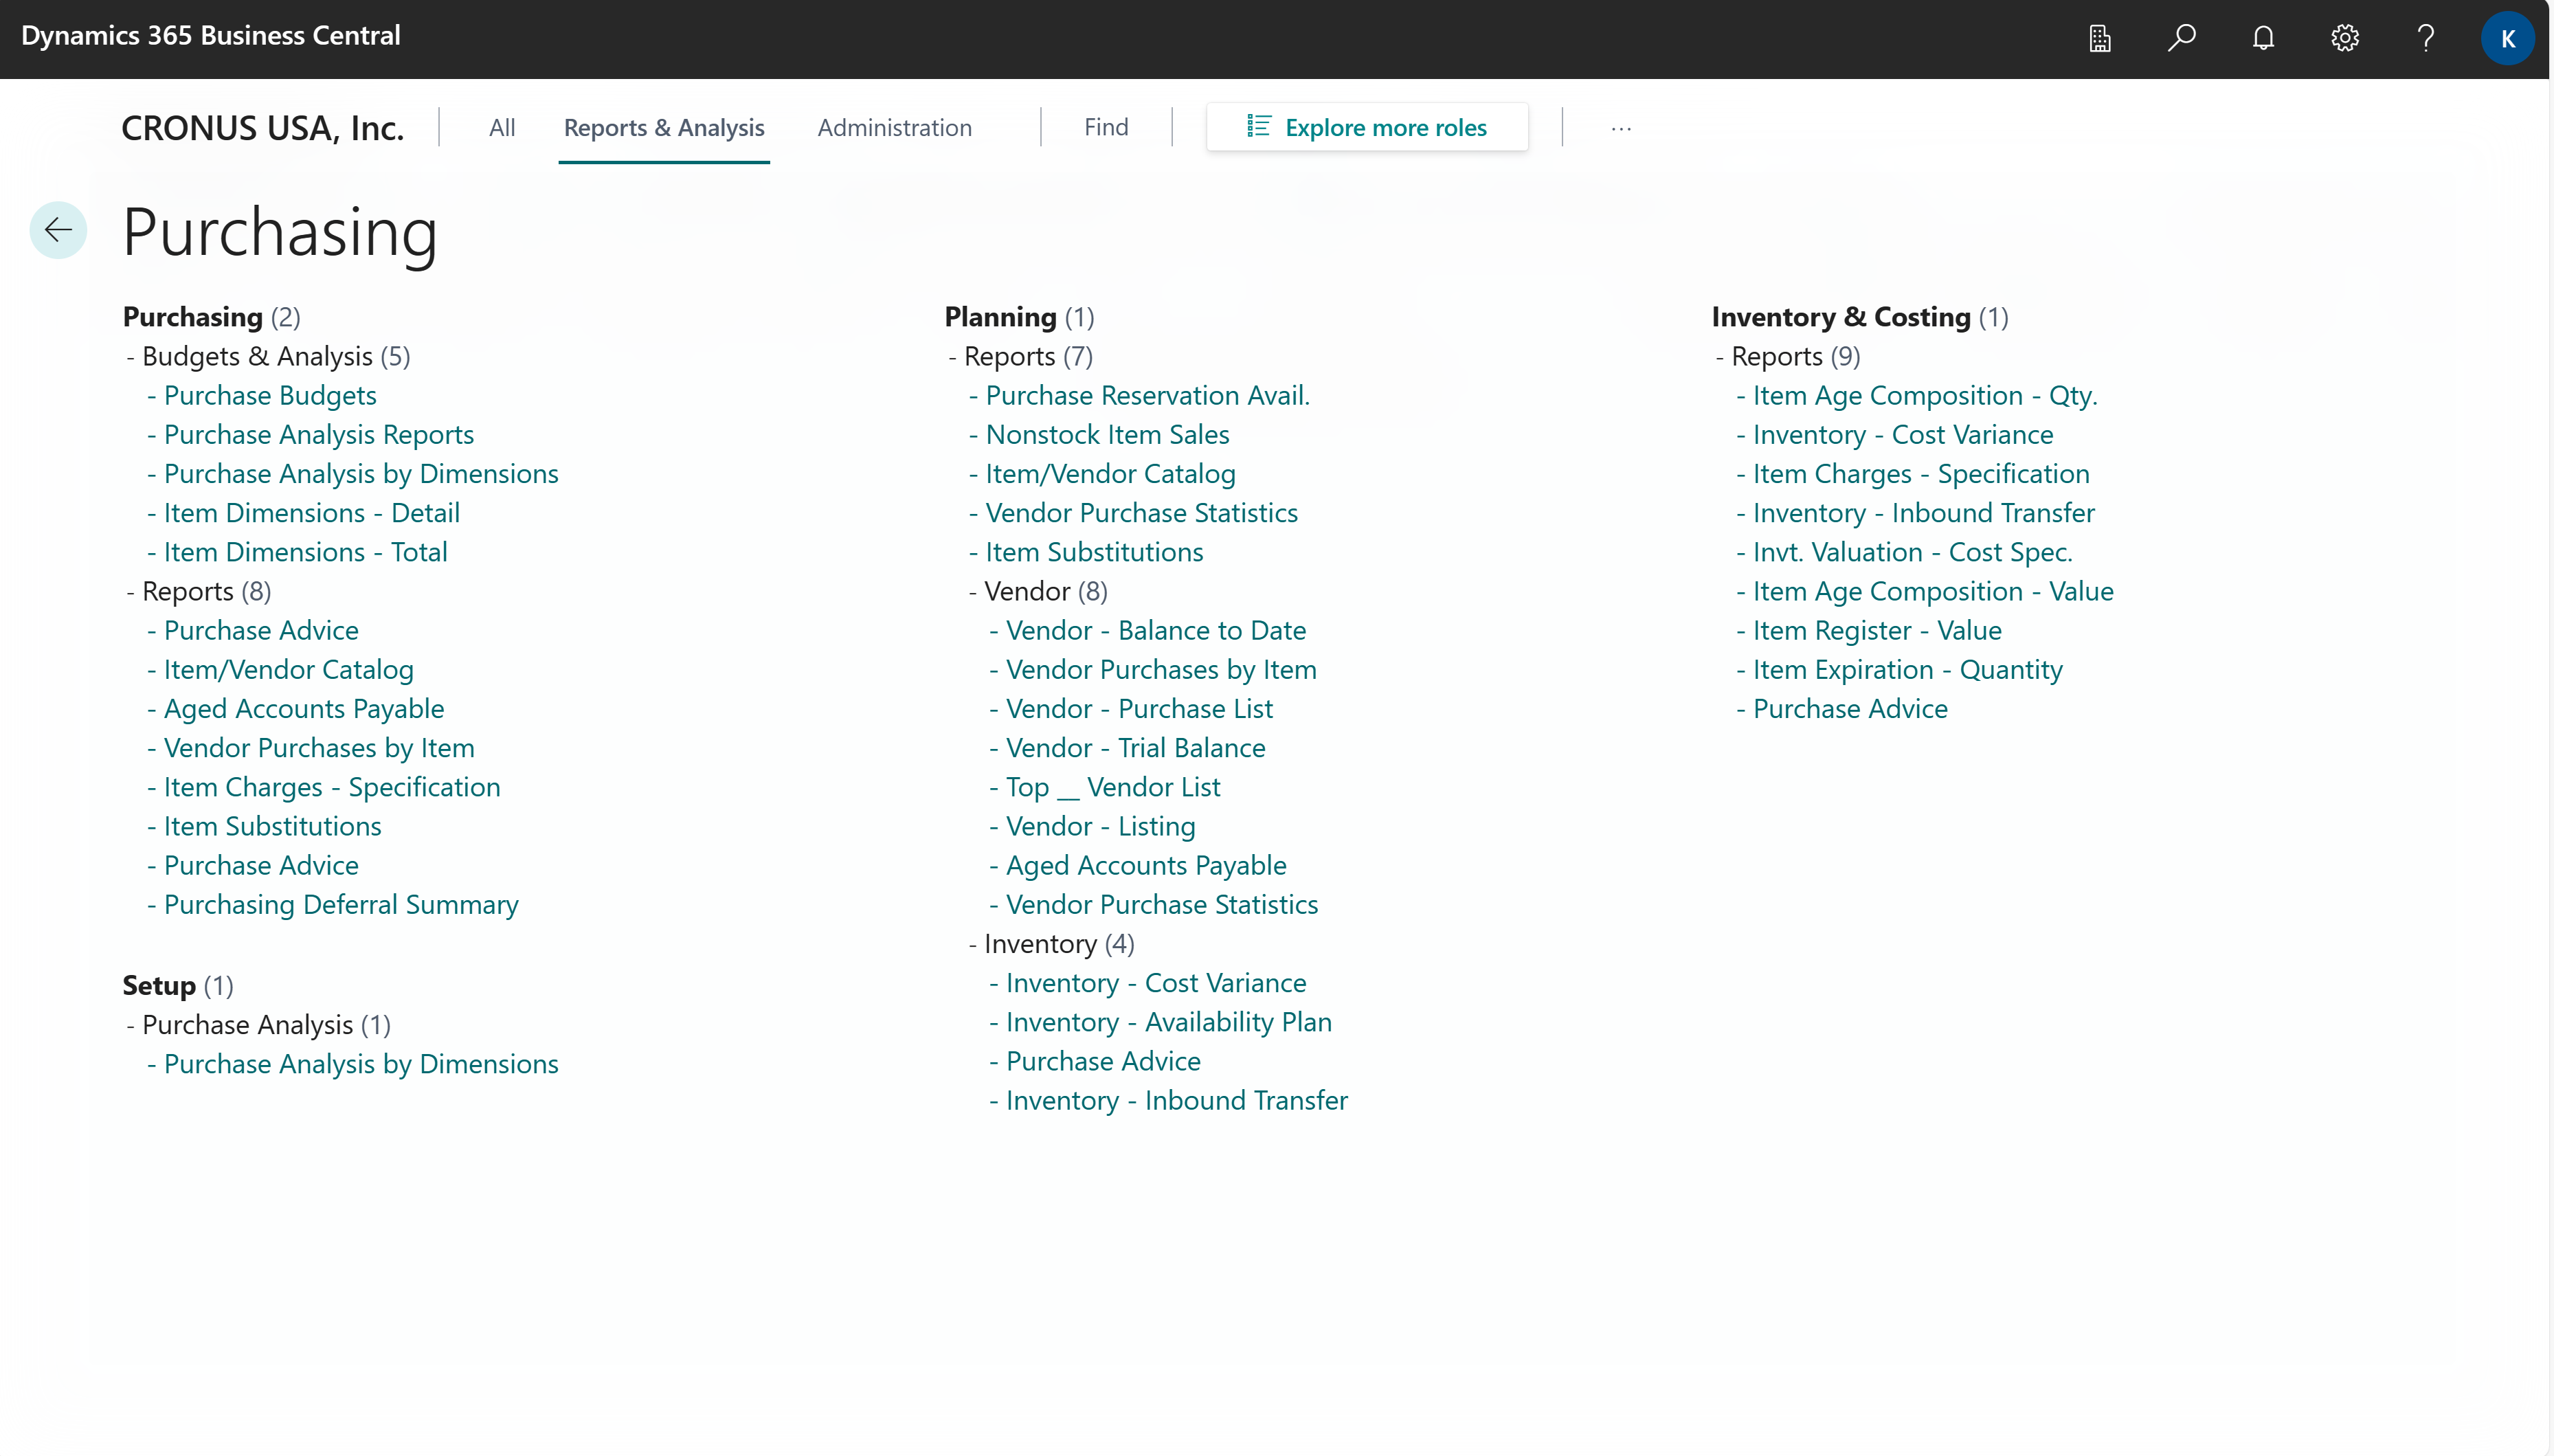
To learn more, go to Finding reports with the Role Explorer.
On-screen purchasing analytics
Business Central has several pages that give you purchasing overviews and tasks to do. Here's an example to get you started:
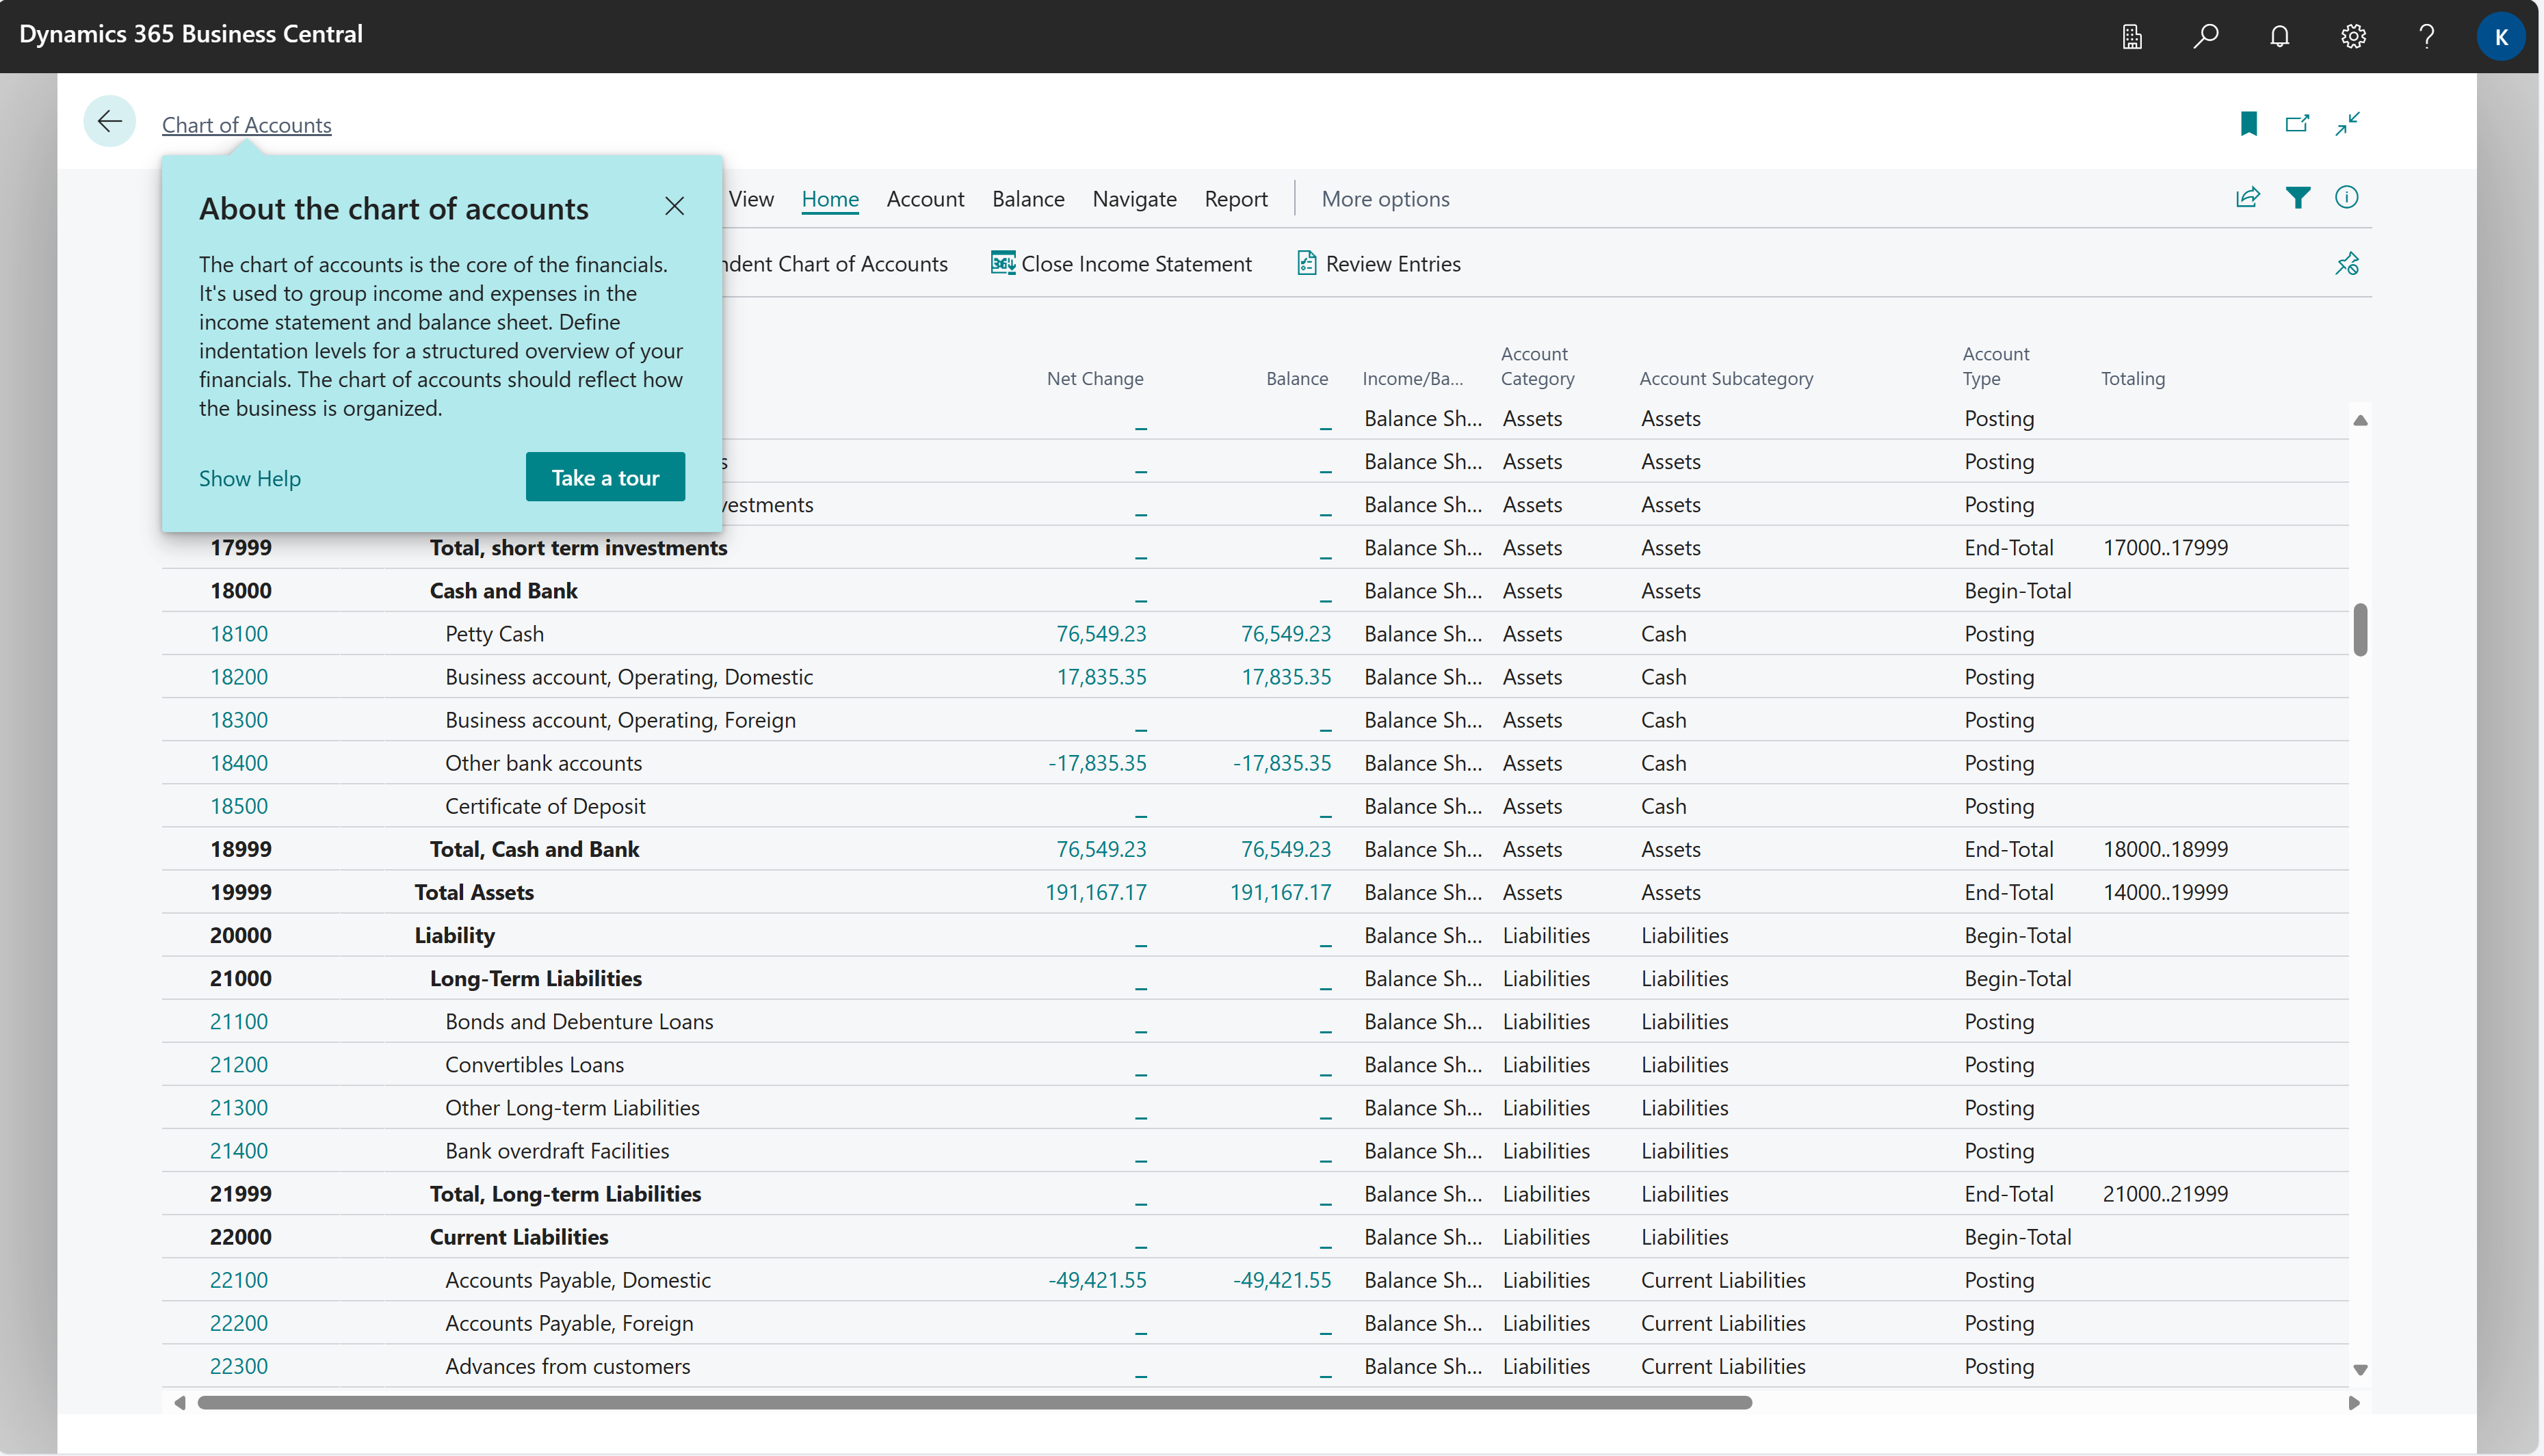
Show purchasing-related general ledger entries and balances from the Chart of Accounts page
The Chart of Accounts page shows all general ledger accounts with aggregated numbers posted to the general ledger. From this page, you can do things like:
- View reports that show general ledger entries and balances.
- Review a list of posting groups for that account.
- View separate debit and credit balances for a single account.
Specifically for purchasing, you can create a view on the Chart of Accounts page that only shows the accounts you use to post purchasing entries.
To learn more, go to Understand the Chart of Accounts.
Analyze data by dimensions (related to purchasing)
Dimensions are values that categorize entries so you can track and analyze them on documents, such as purchase orders. Dimensions can, for example, indicate the project or department an entry came from.
So, instead of setting up separate general ledger accounts for each department or location, you can use dimensions as a basis for analysis and avoid having to create a complicated chart of accounts structure.
To learn more, go to Analyze Data by Dimensions.
Related information
Company consolidation
Power BI Purchasing app
Prepare Financial Reports with Financial Data and Account Categories
Handling finance reporting across business units or legal entities
Ad hoc analysis of purchasing data
Built-in purchasing reports
Understand the Chart of Accounts
Analyze Data by Dimensions
Analytics, business intelligence, and reporting overview
Work with Business Central