Purchases by Item (Power BI Report)
APPLIES TO: Generally available in Business Central 2024 release wave 2.
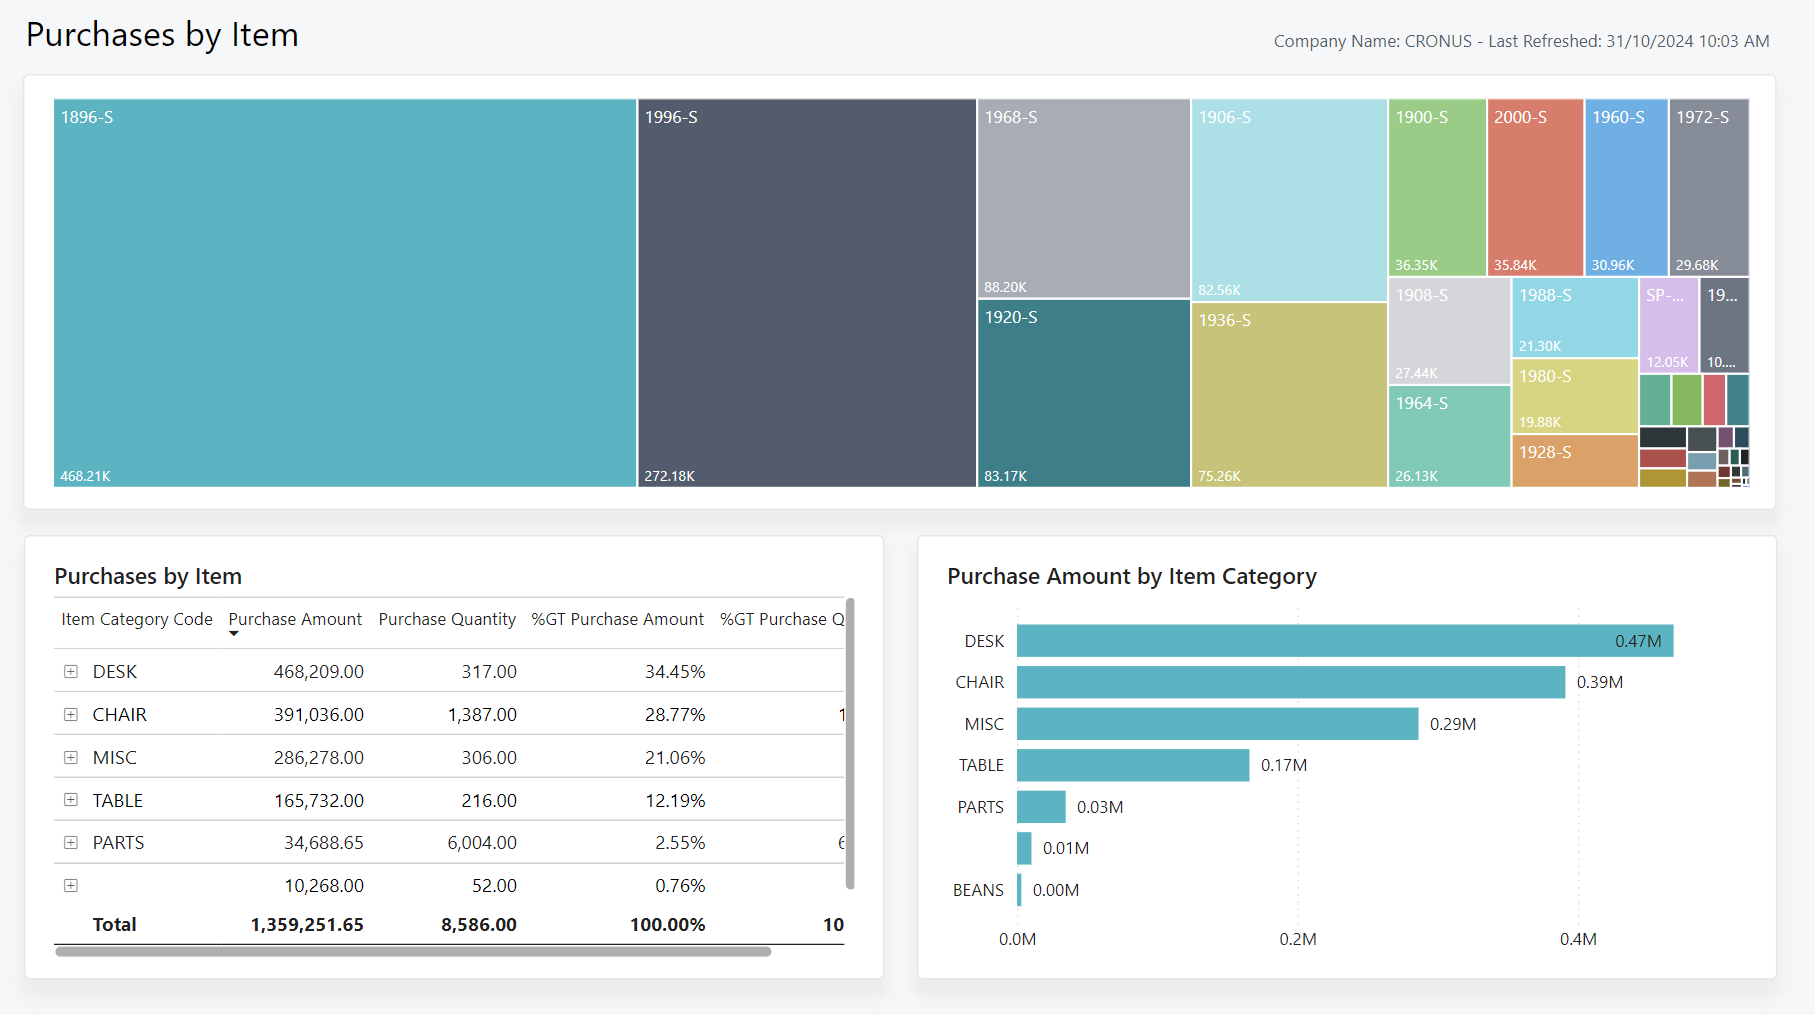
The Purchases by Item report gives a clear picture of your item purchases. It showcases key metrics for each item or item category, such as purchase amount and quantities along with the cost amounts.
Use the report
The report helps purchasing departments who want to closely monitor the organization's purchasing activities.
Purchasing managers want a clear understanding of purchasing activities and how they align with business goals. Use the report to track purchase amounts and quantities for each item or item category. You can also use this report to find discrepancies in purchasing data, optimize the purchasing process, and reduce costs.
Purchasers make purchasing decisions for specific items or categories. You want to ensure that you make informed decisions and get the best value for the organization. Use this report to track purchase amounts and quantities for items or categories.
Key Performance Indicators (KPIs)
The Purchases by Item report includes the following KPIs and measures:
- Purchase (LCY)
- Purchase Quantity
- % GT Purchase (LCY)
- % GT Purchase Quantity
- No. of Posted Purchase Invoices
Click on the link for a KPI to learn more about what it means, how it is calculated, and what data was used in the calculations.
Tip
Tip:
You can easily track the KPIs that the Power BI reports display against your business objectives. To learn more, go to Track your business KPIs with Power BI metrics.
Data used in the report
The report uses data from the following tables in Business Central:
- Purchase Value Entry
- Purchase Invoice Lines
- Purchase Credit Lines
- Item
Try the report
Try the report here: Purchases by Item
Tip
Tip:
If you hold down the CTRL key while you select the report link, the report opens on a new browser tab. In this way, you can stay on the current page while you explore the report on the other browser tab.
Related information
Track KPIs with Power BI metrics
Power BI Purchasing app
Ad hoc analysis of purchasing data
Built-in purchasing reports
Purchasing analytics overview
Purchasing overview