Profitability (Power BI report)
APPLIES TO: Generally available in Business Central 2024 release wave 2.
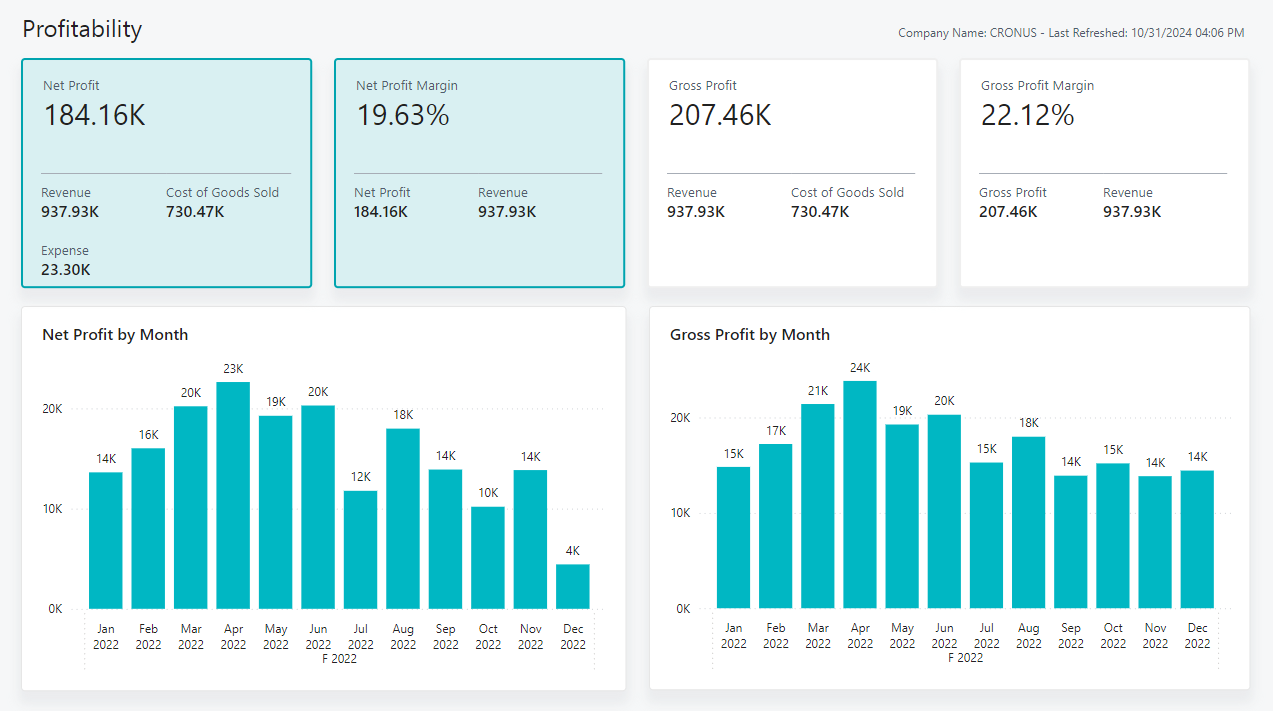
The Profitability report helps executives and high-level decision-makers assess your company's financial success through key performance indicators (KPIs) for important profitability metrics, such as:
- Net profit
- Net profit mMargin
- Gross profit
- Gross profit margin
The KPIs highlight these metrics and their supporting inputs. This report provides a clear view of both gross and net profit trends over time, so you can monitor financial performance and evaluate profitability.
Use the report
The audiences for the report are:
- Executives
- Directors
- Other high-level decision makers
Executives use the report to analyze gross and net profits over time. Combining global and shortcut dimensions with fiscal period filters lets you quickly visualize trends and gain insights into key drivers of financial performance.
Key Performance Indicators (KPIs)
The Profitability report includes the following KPIs and measures:
Click on the link for a KPI to learn more about what it means, how it is calculated, and what data was used in the calculations.
Tip
Tip:
You can easily track the KPIs that the Power BI reports display against your business objectives. To learn more, go to Track your business KPIs with Power BI metrics.
Data used in the report
The report uses data from the following tables in Business Central:
- G/L Entry
- G/L Accounts
- G/L Account Categories
Try the report
Try the report here: Profitability
Tip
Tip:
If you hold down the CTRL key while you select the report link, the report opens on a new browser tab. In this way, you can stay on the current page while you explore the report on the other browser tab.
Related information
Track your business KPIs with Power BI metrics
Power BI finance app
Ad hoc analysis on finance data
Built-in core finance reports
Built-in fixed assets reports
Built-in accounts receivable reports
Built-in accounts payable reports
Financial analytics overview
Finance overview