Liabilities (Power BI report)
APPLIES TO: Generally available in Business Central 2024 release wave 2.
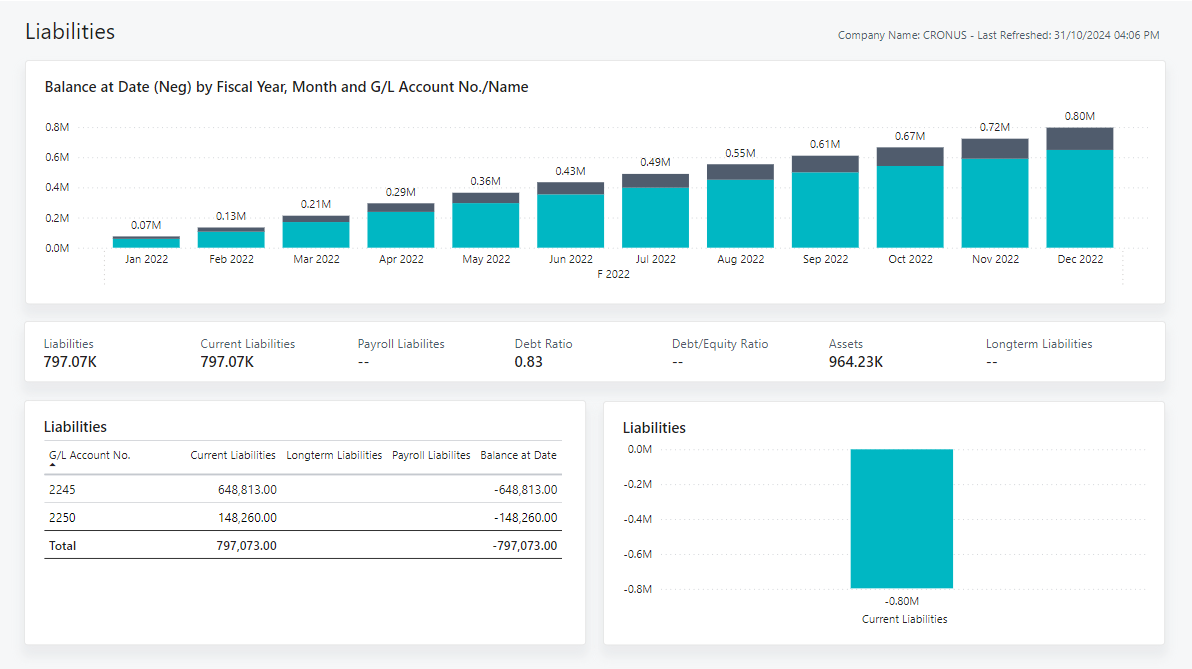
The Liabilities report provides an overview of your company's financial obligations, highlighting total liabilities, current liabilities, payroll liabilities, and long-term liabilities. It also shows key performance indicators such as debt ratio and dept-to-equity ratio, along with total assets.
These key performance indicators can help you understand the balance between debt and equity while monitoring liabilities that affect future cash flow and operational flexibility.
Drill through into the Liabilities Drill-Through page to explore the underlying ledger entries that make up the balance.
Use the report
The audiences for the report are:
- Executives
- Directors
- Other high-level decision makers
Executives can use the report to evaluate your company's financial position before engaging in a new expansive initiative. By first analyzing current liabilities, you can gauge your immediate debt burden. This analysis helps you determine whether there are enough liquid assets to meet short term obligations, and ensure you have cash-flow to support existing operations and new development.
Next, you could assess the debt ratio and debt-to-equity ratios. These key performance indicators provide insight into the company's leverage and risk profile. For example, a high debt-to-equity ratio could indicate that the company has a high reliance on borrowed funds. This type of data can help inform how you decide to finance the expansion project.
Key Performance Indicators (KPIs)
The Liabilities report includes the following KPIs and measures:
- Liabilities
- Current Liabilities
- Payroll Liabilities
- Longterm Liabilities
- Debt Ratio
- Debt/Equity Ratio
- Assets
- Balance at Date (Neg)
Click on the link for a KPI to learn more about what it means, how it is calculated, and what data was used in the calculations.
Tip
Tip:
You can easily track the KPIs that the Power BI reports display against your business objectives. To learn more, go to Track your business KPIs with Power BI metrics.
Data used in the report
The report uses data from the following tables in Business Central:
- G/L Entry
- G/L Accounts
- G/L Account Categories
Try the report
Try the report here: Liabilities
Tip
Tip:
If you hold down the CTRL key while you select the report link, the report opens on a new browser tab. In this way, you can stay on the current page while you explore the report on the other browser tab.
Related information
Track your business KPIs with Power BI metrics
Power BI finance app
Ad hoc analysis on finance data
Built-in core finance reports
Built-in fixed assets reports
Built-in accounts receivable reports
Built-in accounts payable reports
Financial analytics overview
Finance overview