Income Statement by Month (Power BI report)
APPLIES TO: Generally available in Business Central 2024 release wave 2.
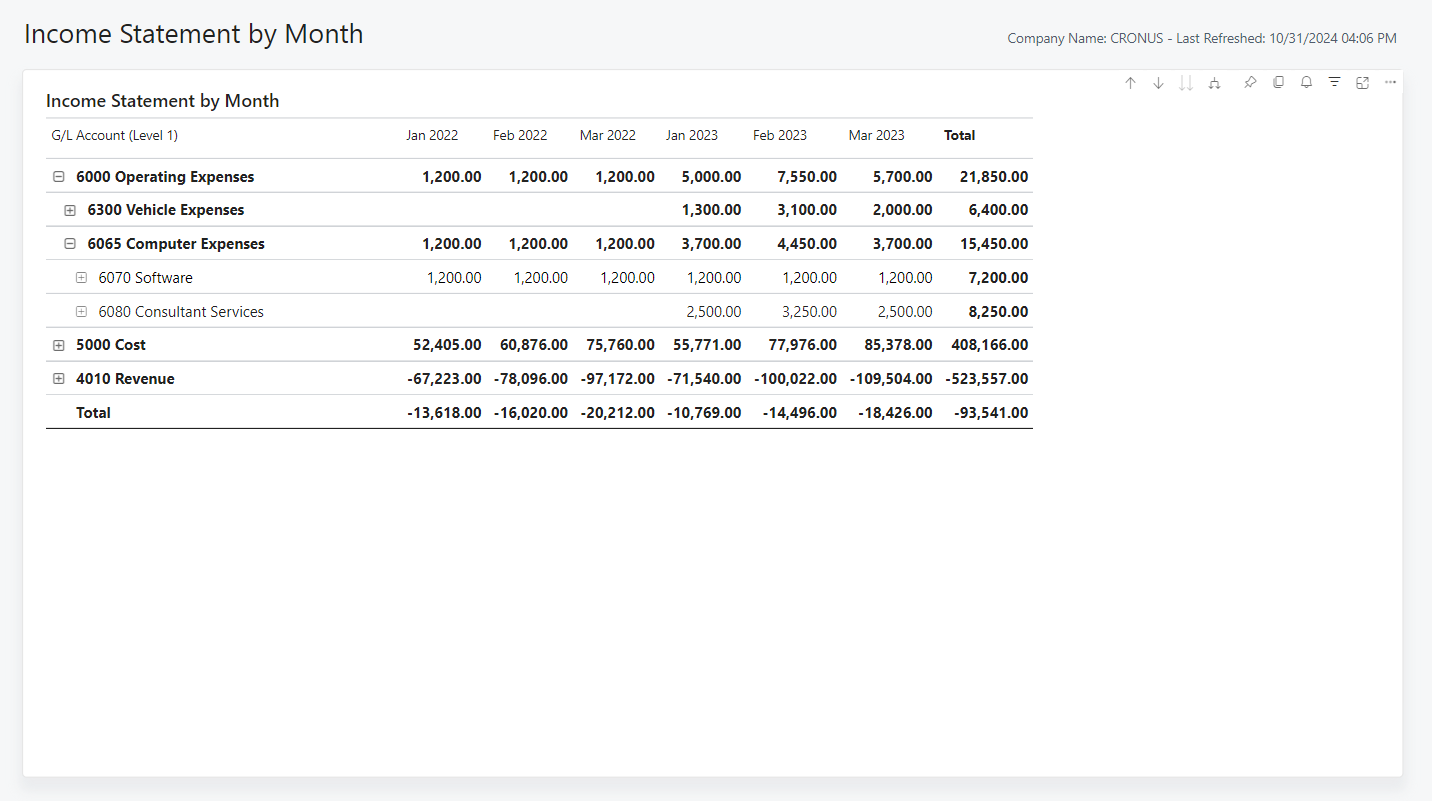
The Income Statement by Month report provides a detailed, month-to-month view of net changes across all income statement accounts, organized in a hierarchy for intuitive navigation. You can explore specific details by drilling down to the Income Statement Drill-Through report, which provides access to the underlying ledger entries.
This report is for senior management and finance administrators, offering a profit and loss overview that supports financial analysis, performance tracking, and informed decision-making.
Use the report
CFOs use the report to analyze monthly profitability trends for the fiscal year. For example, you might review the month-to-month changes in both operating expenses and revenue to identify drivers in overall profitability.
Finance administrators use the report to manage and review the operating expenses by a Department dimension. For example, if you spot an unexpected rise in costs, you could filter the report by department to identify the department responsible for the increased expenditure. This information can help you investigate and realign the department budget, if needed.
Key Performance Indicators (KPIs)
The report includes the following KPIs and measures:
Click on the link for a KPI to learn more about what it means, how it is calculated, and what data was used in the calculations.
Tip
Tip:
You can easily track the KPIs that the Power BI reports display against your business objectives. To learn more, go to Track your business KPIs with Power BI metrics.
Data used in the report
The Income Statement by Month report use data from the following tables in Business Central
- G/L Entry
- G/L Account
Try the report
Try the report here: Income Statement by Month
Tip
Tip:
If you hold down the CTRL key while you select the report link, the report opens on a new browser tab. In this way, you can stay on the current page while you explore the report on the other browser tab.
Related information
Track your business KPIs with Power BI metrics
Power BI finance app
Ad hoc analysis on finance data
Built-in core finance reports
Built-in fixed assets reports
Built-in accounts receivable reports
Built-in accounts payable reports
Financial analytics overview
Finance overview