EBITDA (Power BI report)
APPLIES TO: Generally available in Business Central 2024 release wave 2 (version 25.1).
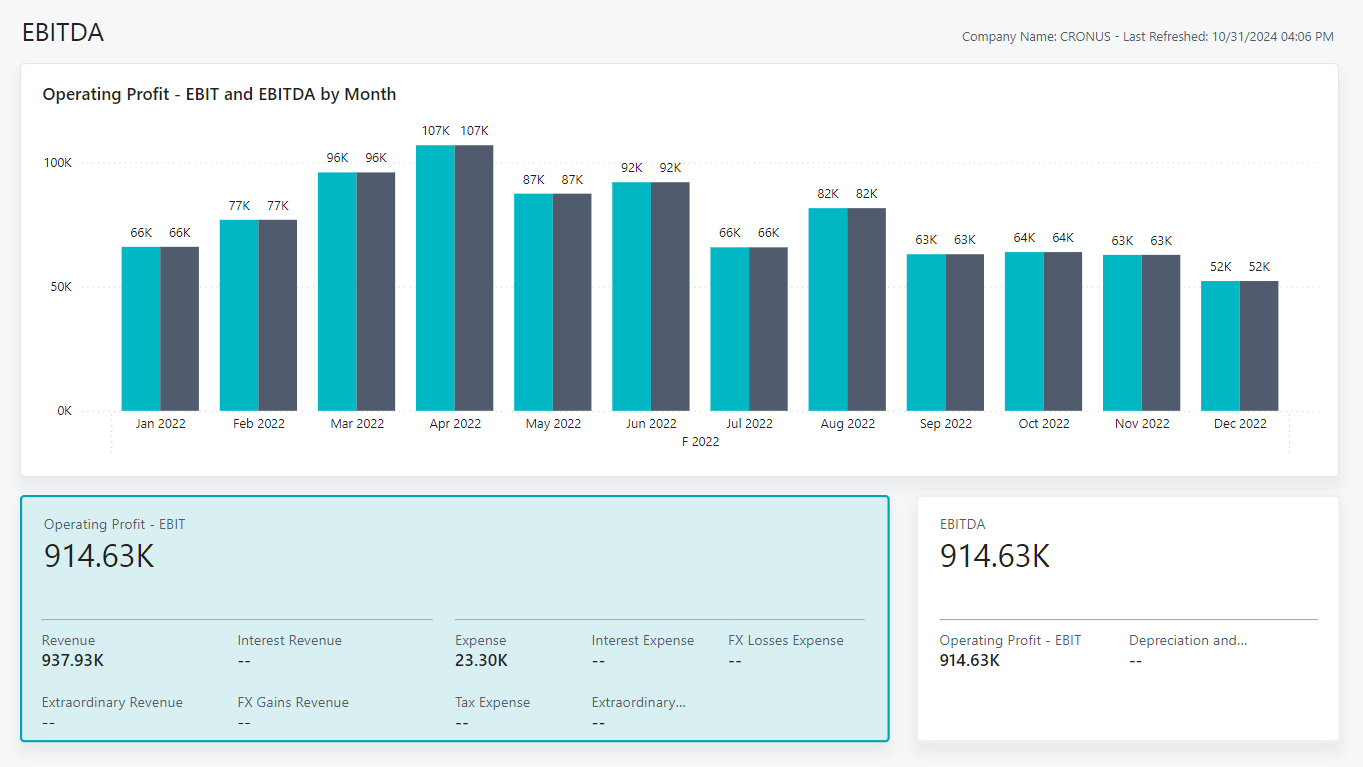
The EBITDA report provides an overview of your company's performance from the perspective of both earnings before interest and taxes (EBIT), and earnings before interest, taxes, depreciation, and amortization (EBITDA). You can review EBIT and EBITDA over time to identify trends in operational performance and inform decisions about cost management and pricing strategies.
Use the report
The audiences for the report are:
- Executives
- Directors
- Other high-level decision makers
Executives use the report to evaluate cash flow potential before making strategic decisions. By analyzing EBIT, you can gauge the efficiency with which your core business generates profits from operations. EBITDA excludes both nonoperational costs and noncash expenses, such as depreciation and amortization. Use EBITDA when you compare your business to your peers in the industry.
EBITDA is good for comparing cash flow potential across similar businesses. EBIT offers a fuller picture of profit by including asset-related costs, which is essential for assessing long-term operational efficiency.
Key Performance Indicators (KPIs)
The EBITDA report includes the following KPIs and measures:
- Operating Profit - EBIT
- EBITDA
- Revenue
- Interest Revenue
- Extraordinary Revenue
- FX Gains Revenue
- Expense
- Interest Expense
- FX Losses Expense
- Tax Expense
- Extraordinary Expense
- Depreciation and Amortization
Click on the link for a KPI to learn more about what it means, how it is calculated, and what data was used in the calculations.
Tip
Tip:
You can easily track the KPIs that the Power BI reports display against your business objectives. To learn more, go to Track your business KPIs with Power BI metrics.
Data used in the report
The report uses data from the following tables in Business Central:
- G/L Entry
- G/L Accounts
- G/L Account Categories
Try the report
Try the report here: EBITDA
Tip
Tip:
If you hold down the CTRL key while you select the report link, the report opens on a new browser tab. In this way, you can stay on the current page while you explore the report on the other browser tab.
See also
Track your business KPIs with Power BI metrics
Power BI finance app
Ad hoc analysis on finance data
Built-in core finance reports
Built-in fixed assets reports
Built-in accounts receivable reports
Built-in accounts payable reports
Financial analytics overview
Finance overview