Budget Comparison (Power BI report)
APPLIES TO: Generally available in Business Central 2024 release wave 2.
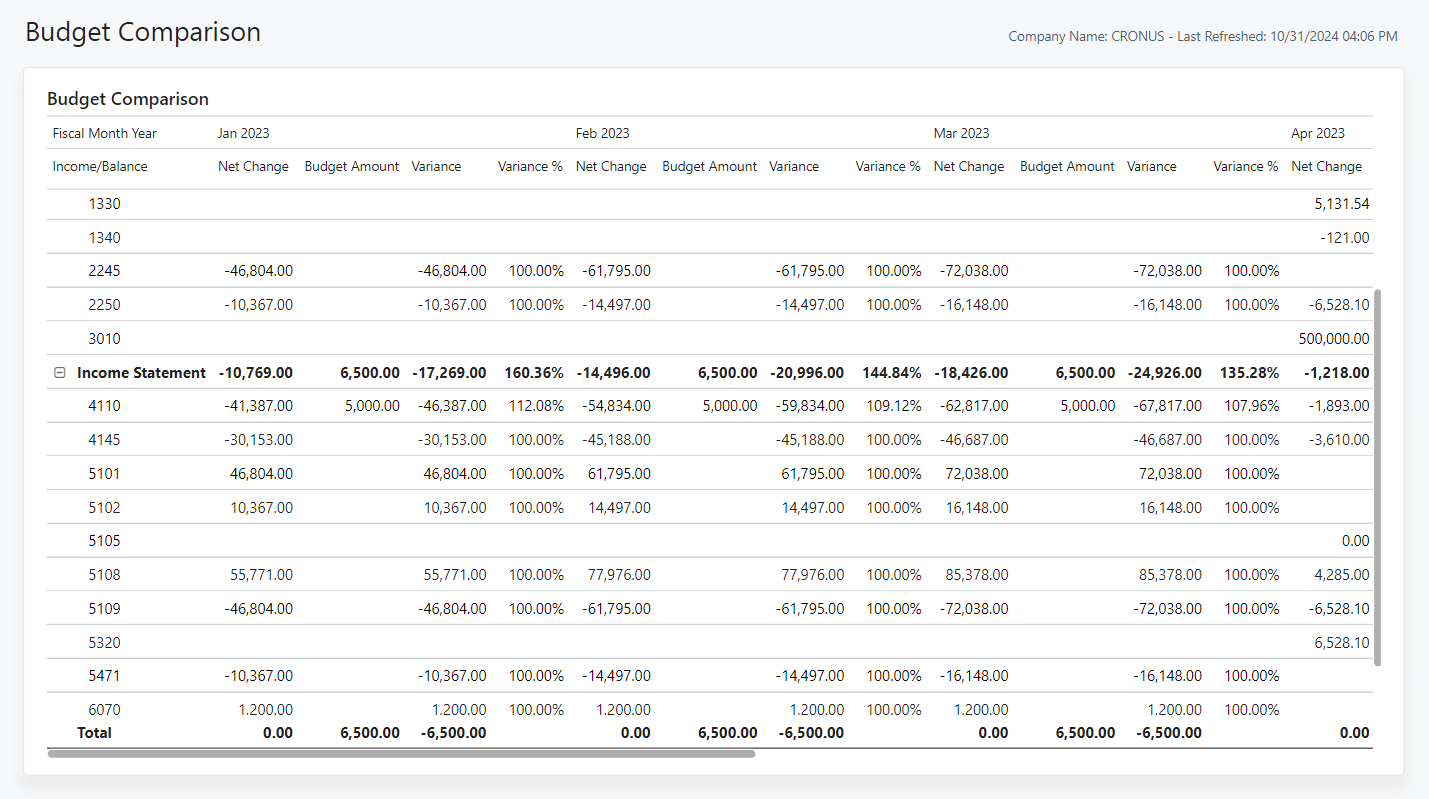
The Budget Comparison report provides a comparative view of your company's financial performance with budgeted targets. The report lays out data by month to offer a month-to-month analysis, and it categorizes accounts by income statement or balance sheet.
Use the report
The audiences for the report are:
- Executives
- Finance Managers
Executive or finance managers use the report to monitor your company's financial performance. By filtering by different G/L budgets, shortcut dimensions, and fiscal periods, you can assess performance against various benchmarks. Analyzing the net change and variance metrics helps you identify accounts that need attention, ultimately leading to improved planning and more strategic decision-making.
Key Performance Indicators (KPIs)
The Budget Comparison report includes the following KPIs and measures:
Click on the link for a KPI to learn more about what it means, how it is calculated, and what data was used in the calculations.
Tip
Tip:
You can easily track the KPIs that the Power BI reports display against your business objectives. To learn more, go to Track your business KPIs with Power BI metrics.
Data used in the report
The report uses data from the following tables in Business Central:
- G/L Account
- G/L Entry
- G/L Budget Entry
Try the report
Try the report here: Budget Comparison
Tip
Tip:
If you hold down the CTRL key while you select the report link, the report opens on a new browser tab. In this way, you can stay on the current page while you explore the report on the other browser tab.
Related information
Track your business KPIs with Power BI metrics
Power BI finance app
Ad hoc analysis on finance data
Built-in core finance reports
Built-in fixed assets reports
Built-in accounts receivable reports
Built-in accounts payable reports
Financial analytics overview
Finance overview