Average Collection Period (Power BI report)
APPLIES TO: Generally available in Business Central 2024 release wave 2.
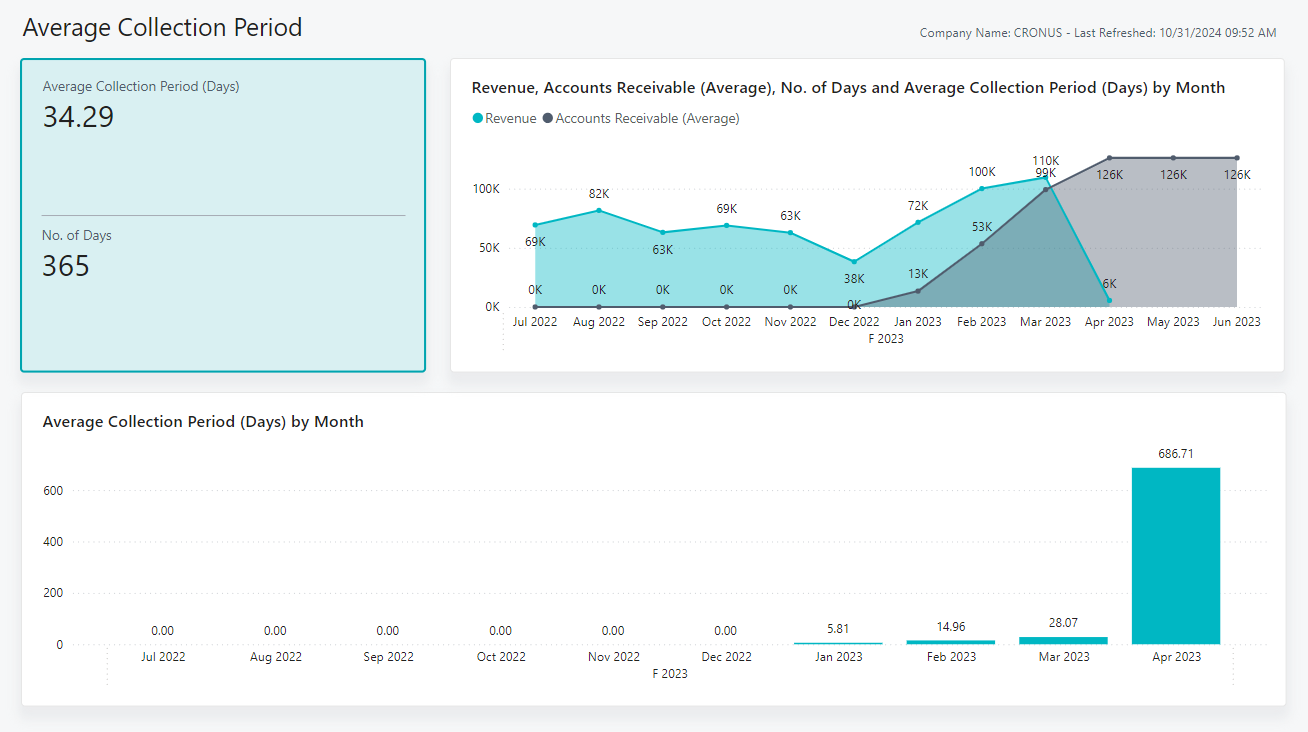
The Average Collection Period report shows the average number of days it takes for your company to receive payments from customers. The report can help you assess the efficiency of your receivables collection process.
Use the report
The audiences for the report are:
- Executives
- Directors
- Other high-level decision makers
Executive or finance managers use this report to monitor and track the effectiveness of your collection process. By analyzing and tracking the average collection period in days, you can identify trends that might affect cash flow. The report can help ensure that you collect receivables quickly enough to cover upcoming cash needs, and help you plan for better cash flow. By monitoring the average collection period, you can anticipate cash flow shortages.
Key Performance Indicators (KPIs)
The Average Collection Period report includes the following KPIs and measures:
Click on the link for a KPI to learn more about what it means, how it is calculated, and what data was used in the calculations.
Tip
Tip:
You can easily track the KPIs that the Power BI reports display against your business objectives. To learn more, go to Track your business KPIs with Power BI metrics.
Data used in the report
The report uses data from the following tables in Business Central:
- G/L Entry
- G/L Accounts
- G/L Account Categories
Try the report
Try the report here: Average Collection Period
Tip
Tip:
If you hold down the CTRL key while you select the report link, the report opens on a new browser tab. In this way, you can stay on the current page while you explore the report on the other browser tab.
Related information
Track your business KPIs with Power BI metrics
Power BI finance app
Ad hoc analysis on finance data
Built-in core finance reports
Built-in fixed assets reports
Built-in accounts receivable reports
Built-in accounts payable reports
Financial analytics overview
Finance overview