Aged Payables (Back Dating) (Power BI report)
APPLIES TO: Generally available in Business Central 2024 release wave 2.
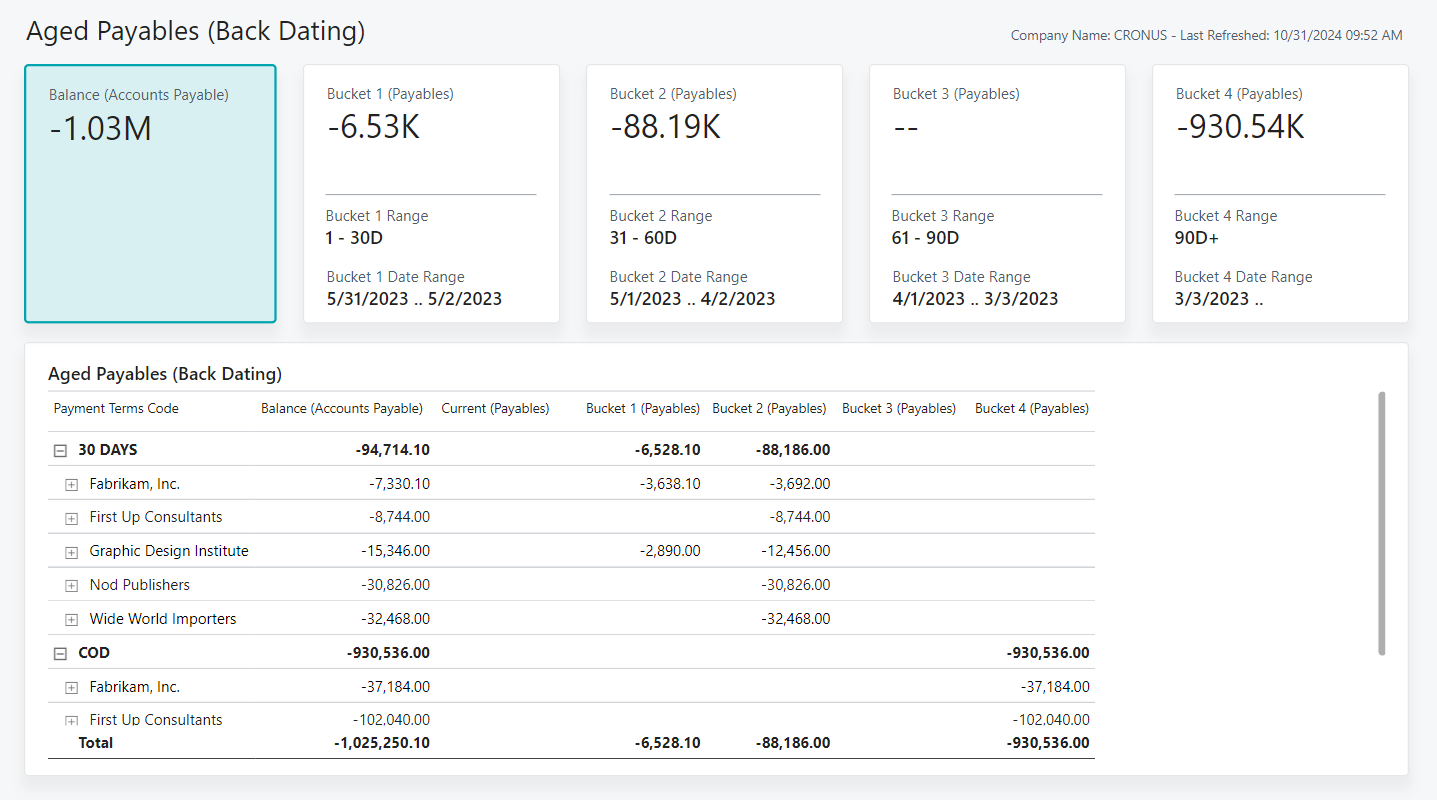
The Aged Payables (Back Dating) report allows you to analyze outstanding vendor balances grouped by customizable aging periods. You can age the report by posting date, due date, or document date. It categorizes vendor balances by payment terms code, so you can quickly align net terms with aging buckets for efficient analysis. This approach helps you prioritize payment efforts and manage cash flow effectively.
Use the report
The audiences for the report are:
- Executives
- Finance administrators
Finance administrators can use the report to prioritize vendor payments and take advantage of discounts for early payments. By aging the report based on due dates and setting the appropriate aging period buckets, you can effectively manage payment schedules. This approach enhances cash flow and strengthens relationships with key vendors.
Key Performance Indicators (KPIs)
The Aged Payables (Back Dating) report includes the following KPIs and measures:
- Balance (Accounts Payable)
- Current (Payables)
- Bucket 1 (Payables)
- Bucket 2 (Payables)
- Bucket 3 (Payables)
- Bucket 4 (Payables)
Click on the link for a KPI to learn more about what it means, how it is calculated, and what data was used in the calculations.
Tip
Tip:
You can easily track the KPIs that the Power BI reports display against your business objectives. To learn more, go to Track your business KPIs with Power BI metrics.
Data used in the report
The report uses data from the following tables in Business Central:
- Vendor
- Vendor Ledger Entry
- Detailed Vendor Ledger Entry
Try the report
Try the report here: Aged Payables (Back Dating)
Tip
Tip:
If you hold down the CTRL key while you select the report link, the report opens on a new browser tab. In this way, you can stay on the current page while you explore the report on the other browser tab.
Related information
Track your business KPIs with Power BI metrics
Power BI finance app
Ad hoc analysis on finance data
Built-in core finance reports
Built-in fixed assets reports
Built-in accounts receivable reports
Built-in accounts payable reports
Financial analytics overview
Finance overview