Consolidated Trial Balance Excel (report)
The Consolidated Trial Balance Excel report shows the net change or balances of general ledger accounts for a selected period, aggregated for each business unit.
The Excel workbook contains worksheets that you can use to analyze your trial balance:
- Trial-Balance (LCY)
- By-Business-Unit (LCY)
- Trial-Balance (ACY)
- By-Business-Unit (ACY)
- TrialBalanceData
Use the worksheets to analyze data in different ways.
Tip
Tip:
If you configure OneDrive for system features, the Excel workbook opens in your browser in Excel online.
Note
Note:
This report does the calculations when you view it in Excel online, or when you download and open it. If a banner displays text about external data connections, you might need to choose the Enable content button to load data. The report doesn't connect to any external data sources. All calculations are done in Excel with Power Query. In some cases (depending on the security configurations for your organization), you might also need to right-click on a pivot table in one of the worksheets and choose Refresh to update data in the reports.
Filters and slicers let you zoom in on the balance as seen from business units, global dimensions, or by account categories and subcategories.
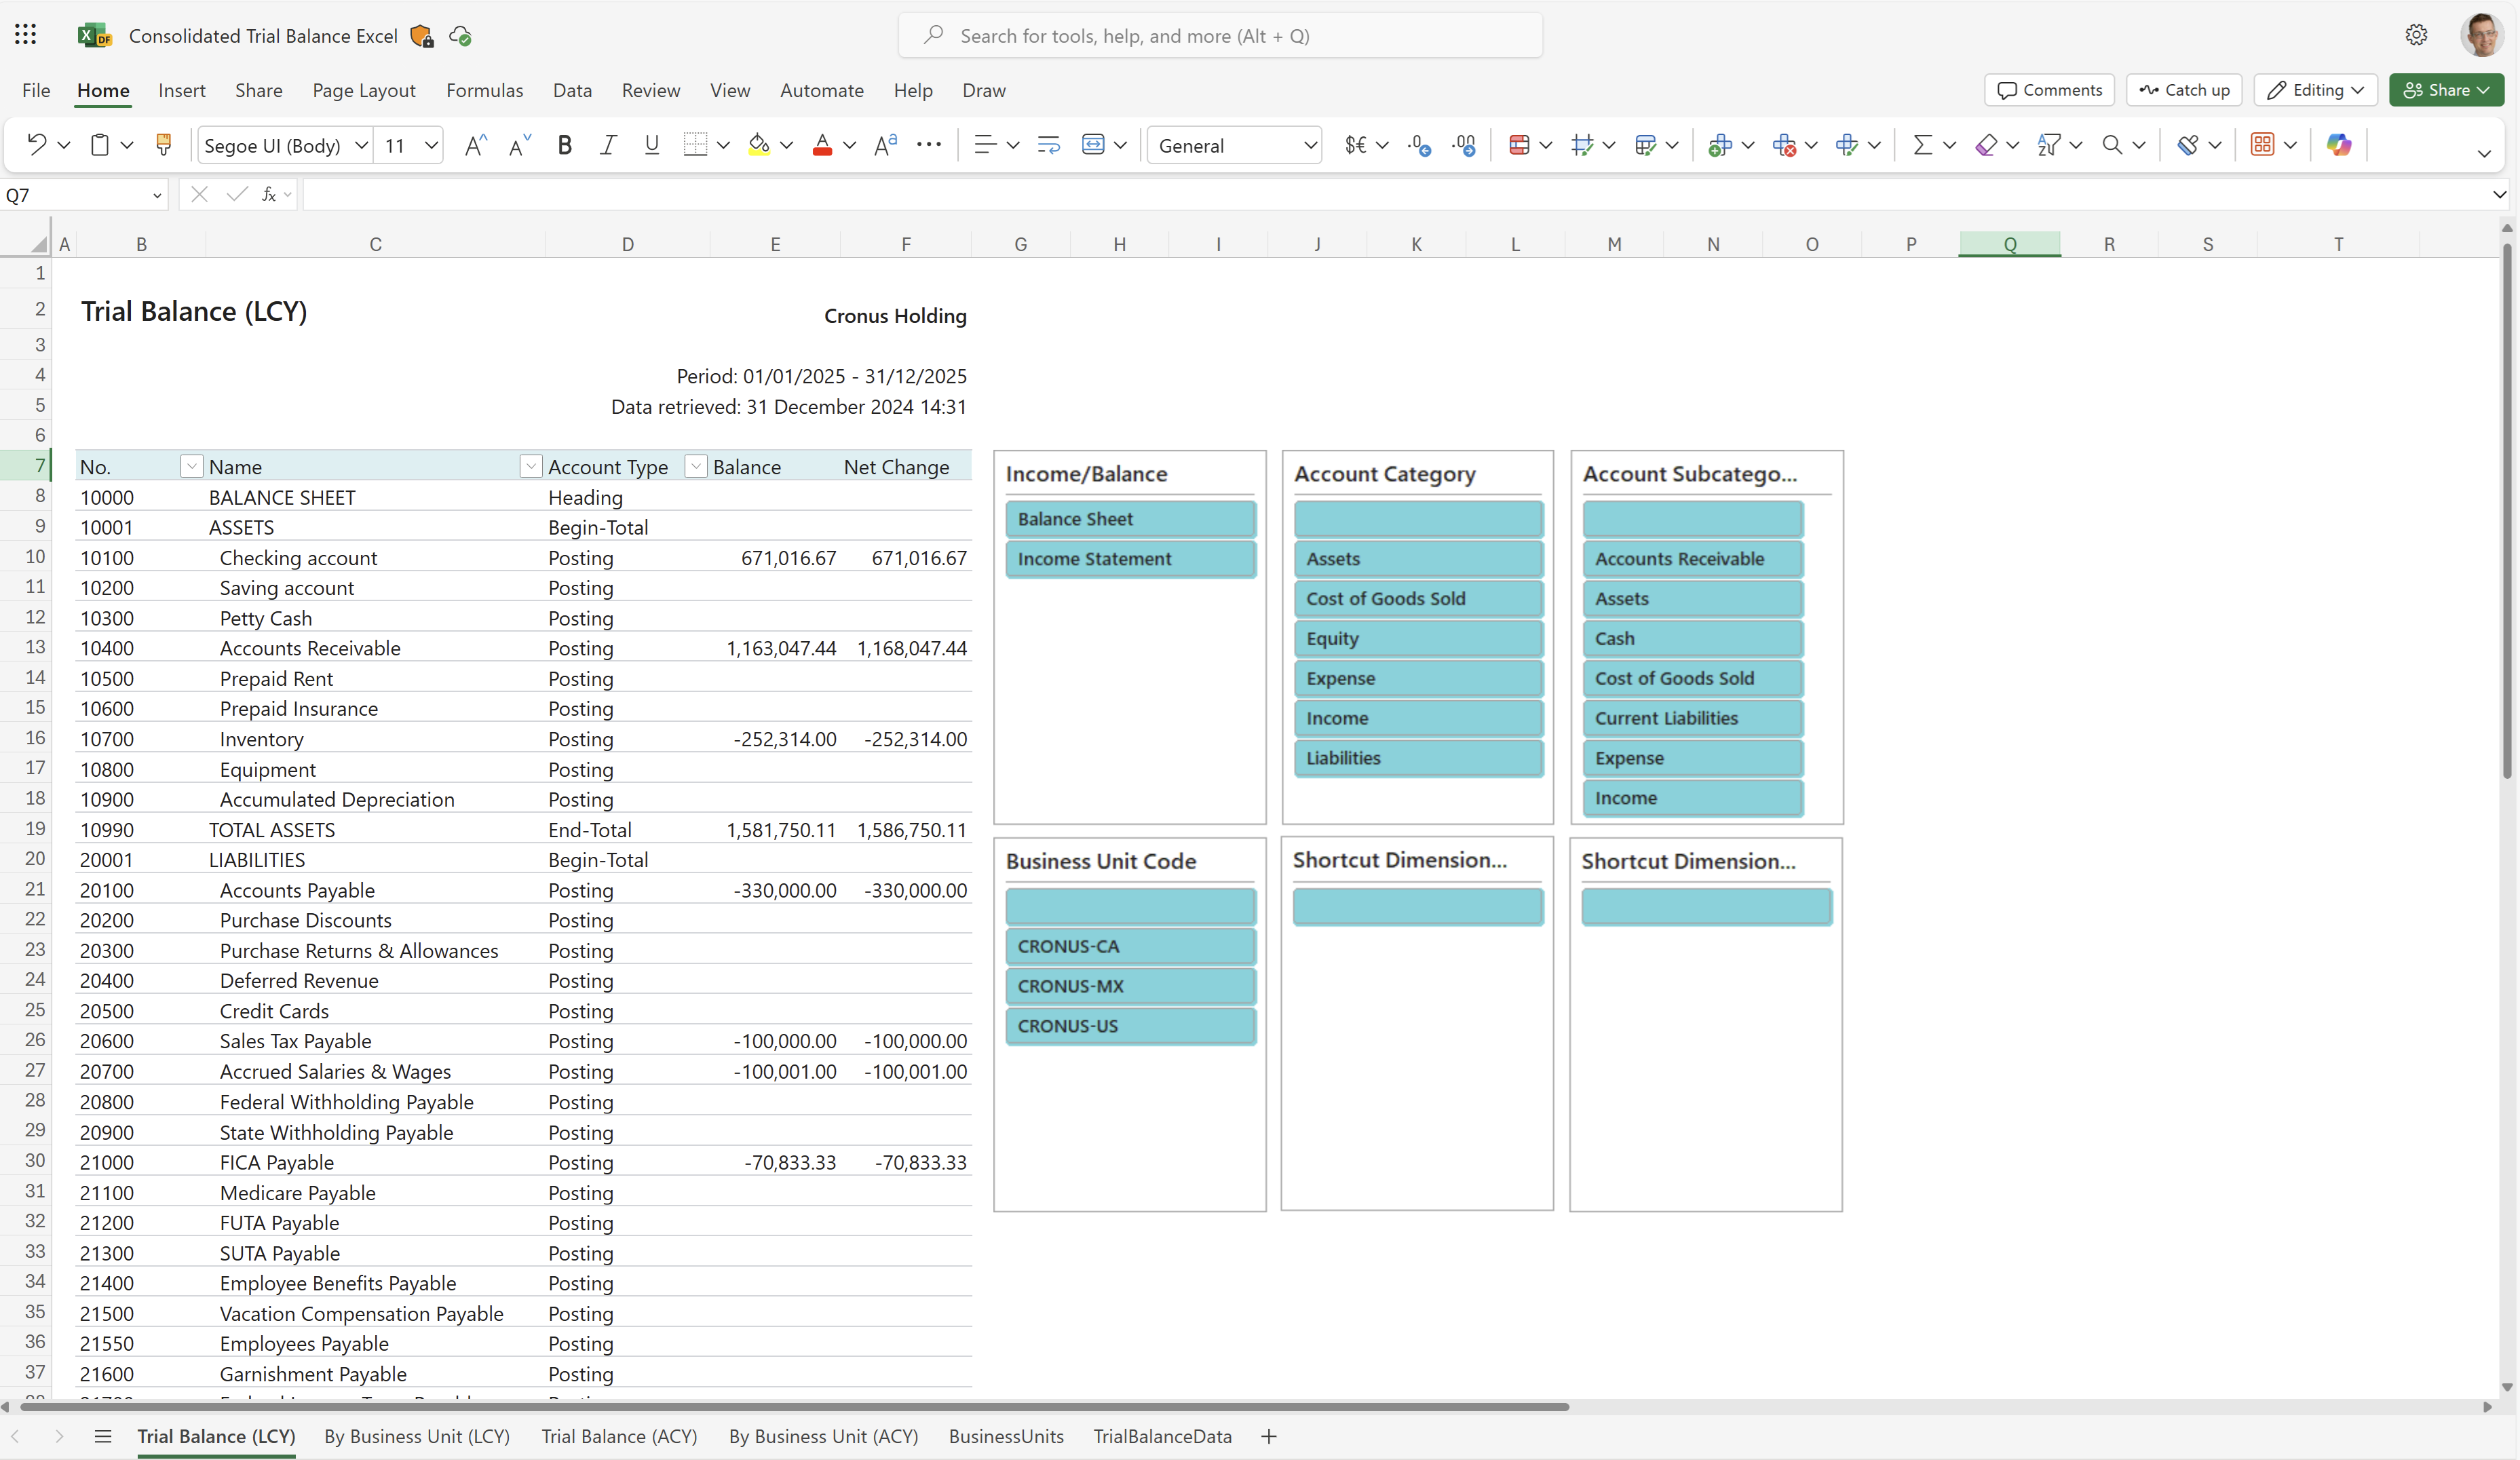
Trial Balance (LCY) worksheet
This worksheet shows the trial balance for the consolidation company with amounts in local currency (LCY).
Tip
Tip:
The data is shown in an Excel pivot table. Choose any cell with data to open the Field List, where you can arrange fields, group or ungroup data, and filter data. To learn more, go to the following articles:
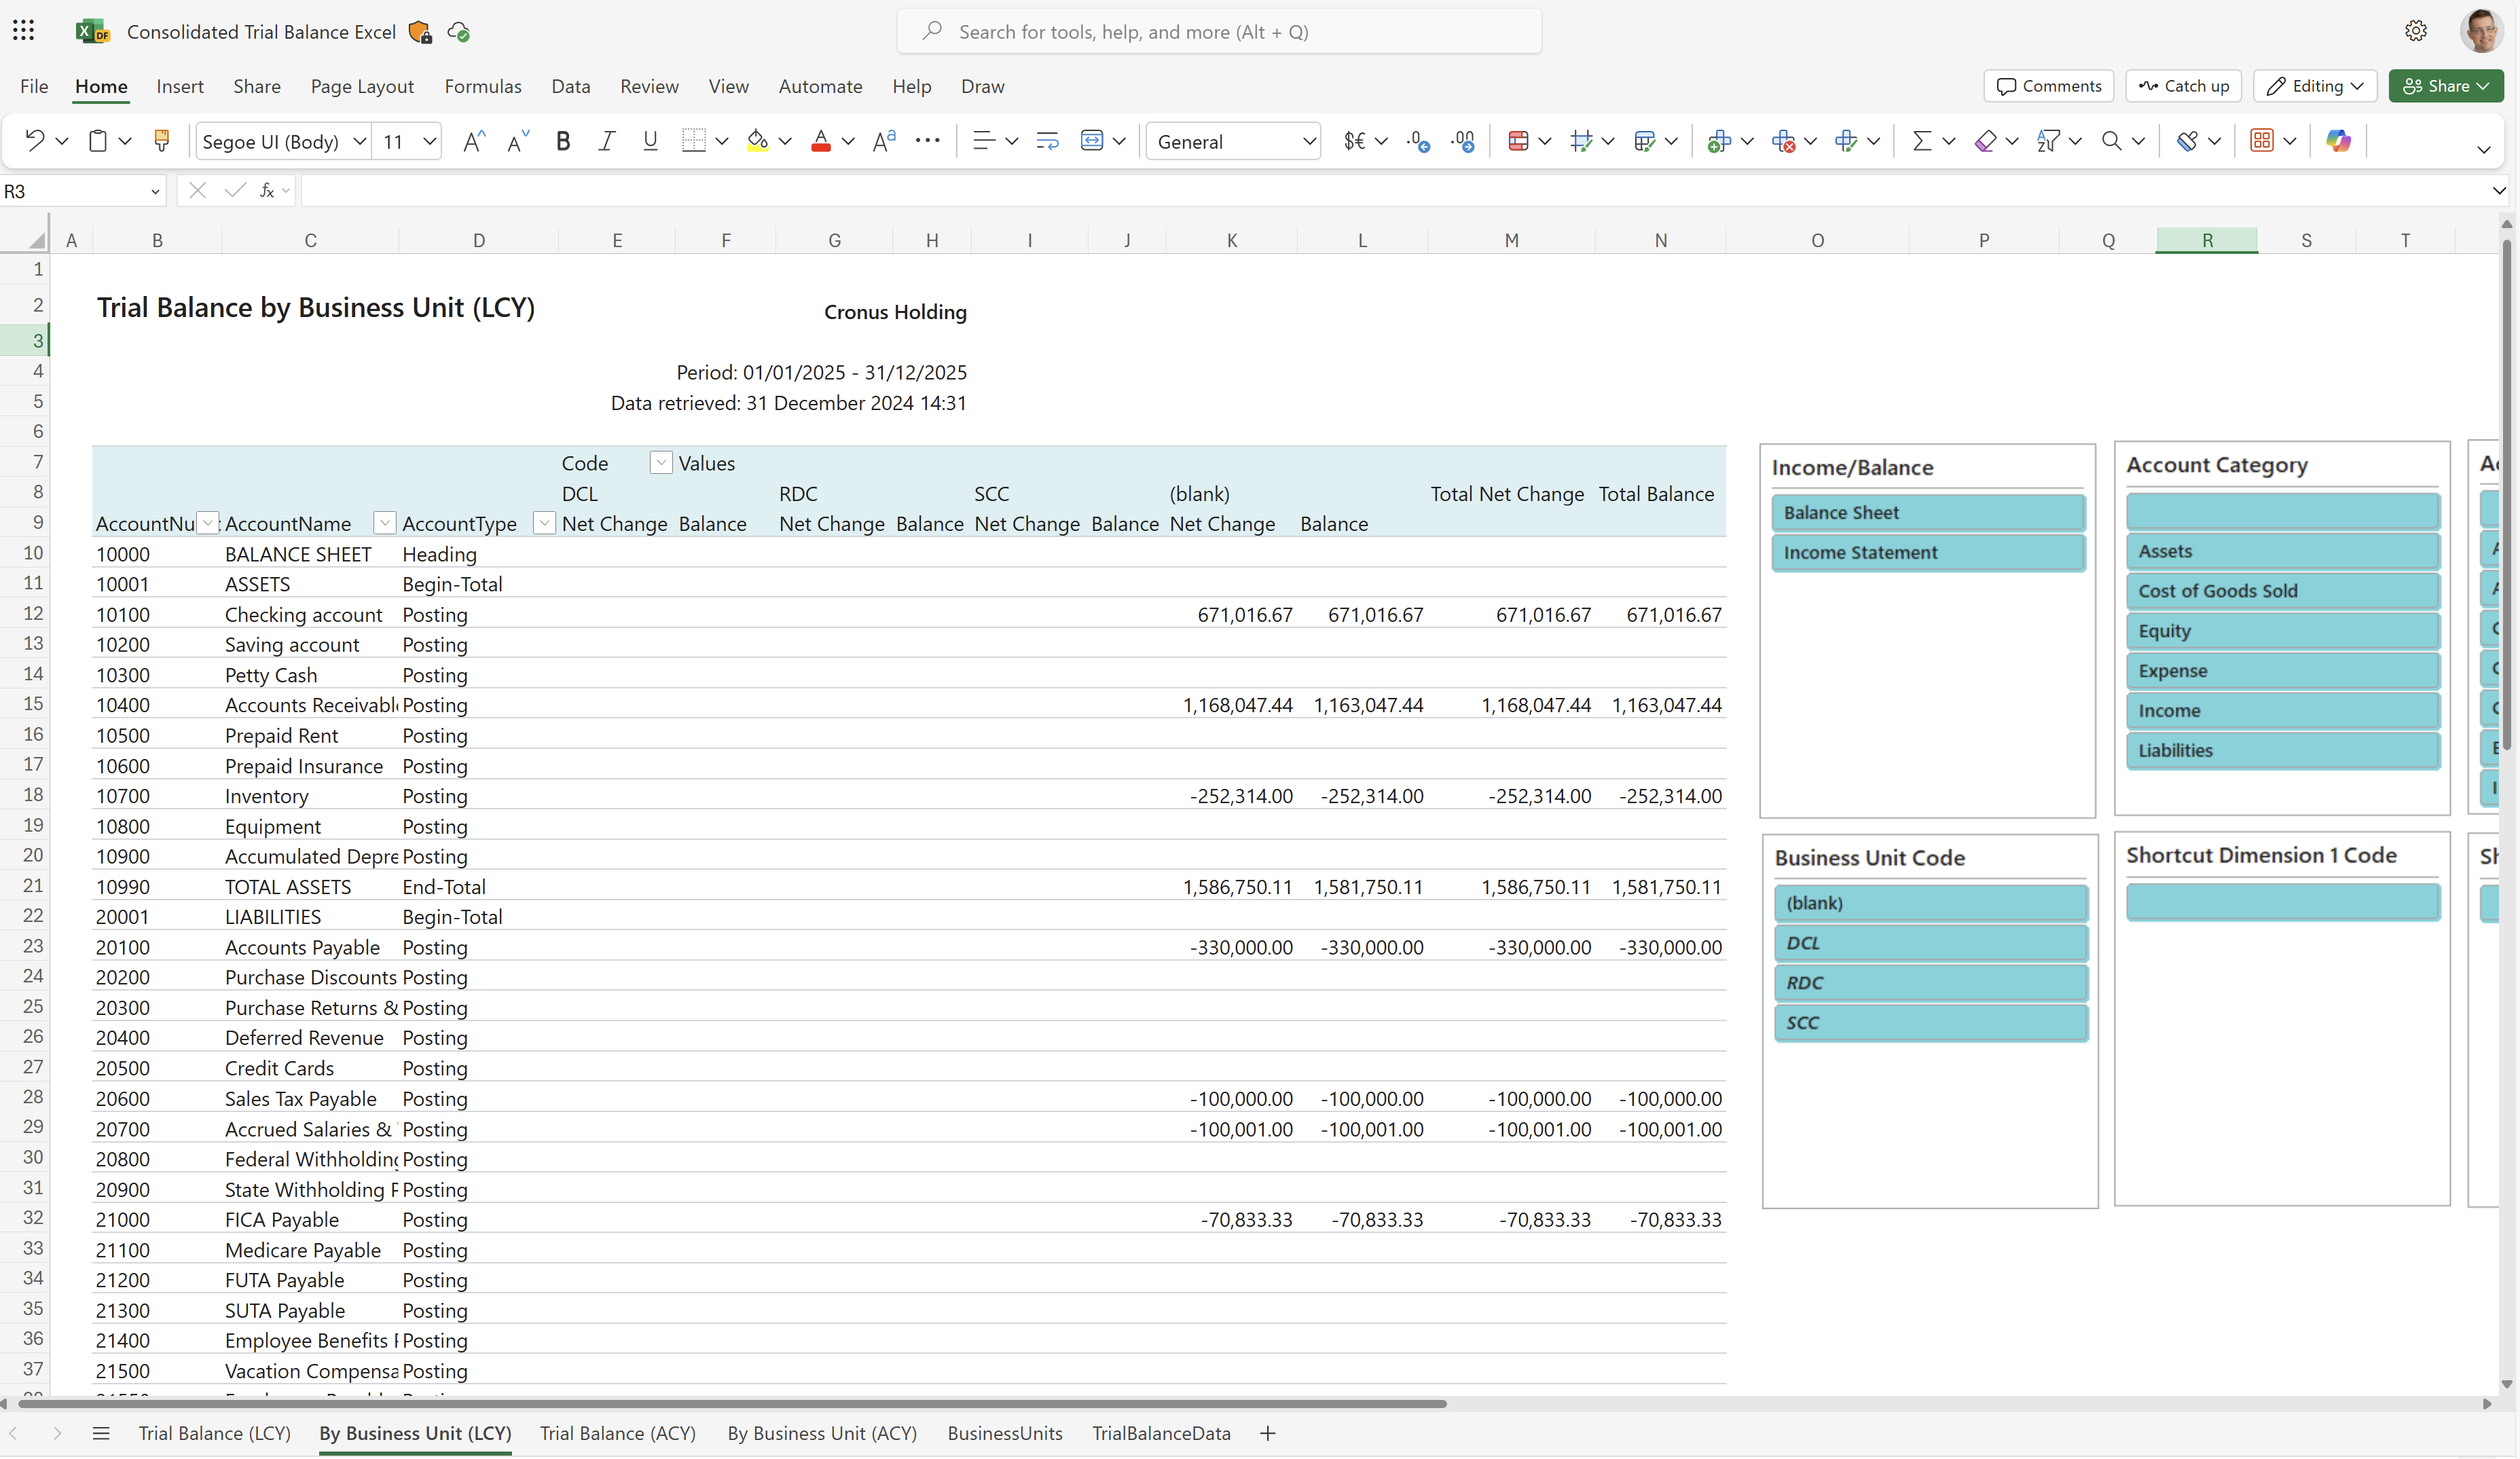
By Business Unit (LCY) worksheet
This worksheet shows the trial balance for the consolidation company with amounts in LCY for your business units.
Tip
Tip:
The data is shown in an Excel pivot table. Choose any cell with data to open the Field List, where you can arrange fields, group or ungroup data, and filter data. To learn more, go to the following articles:
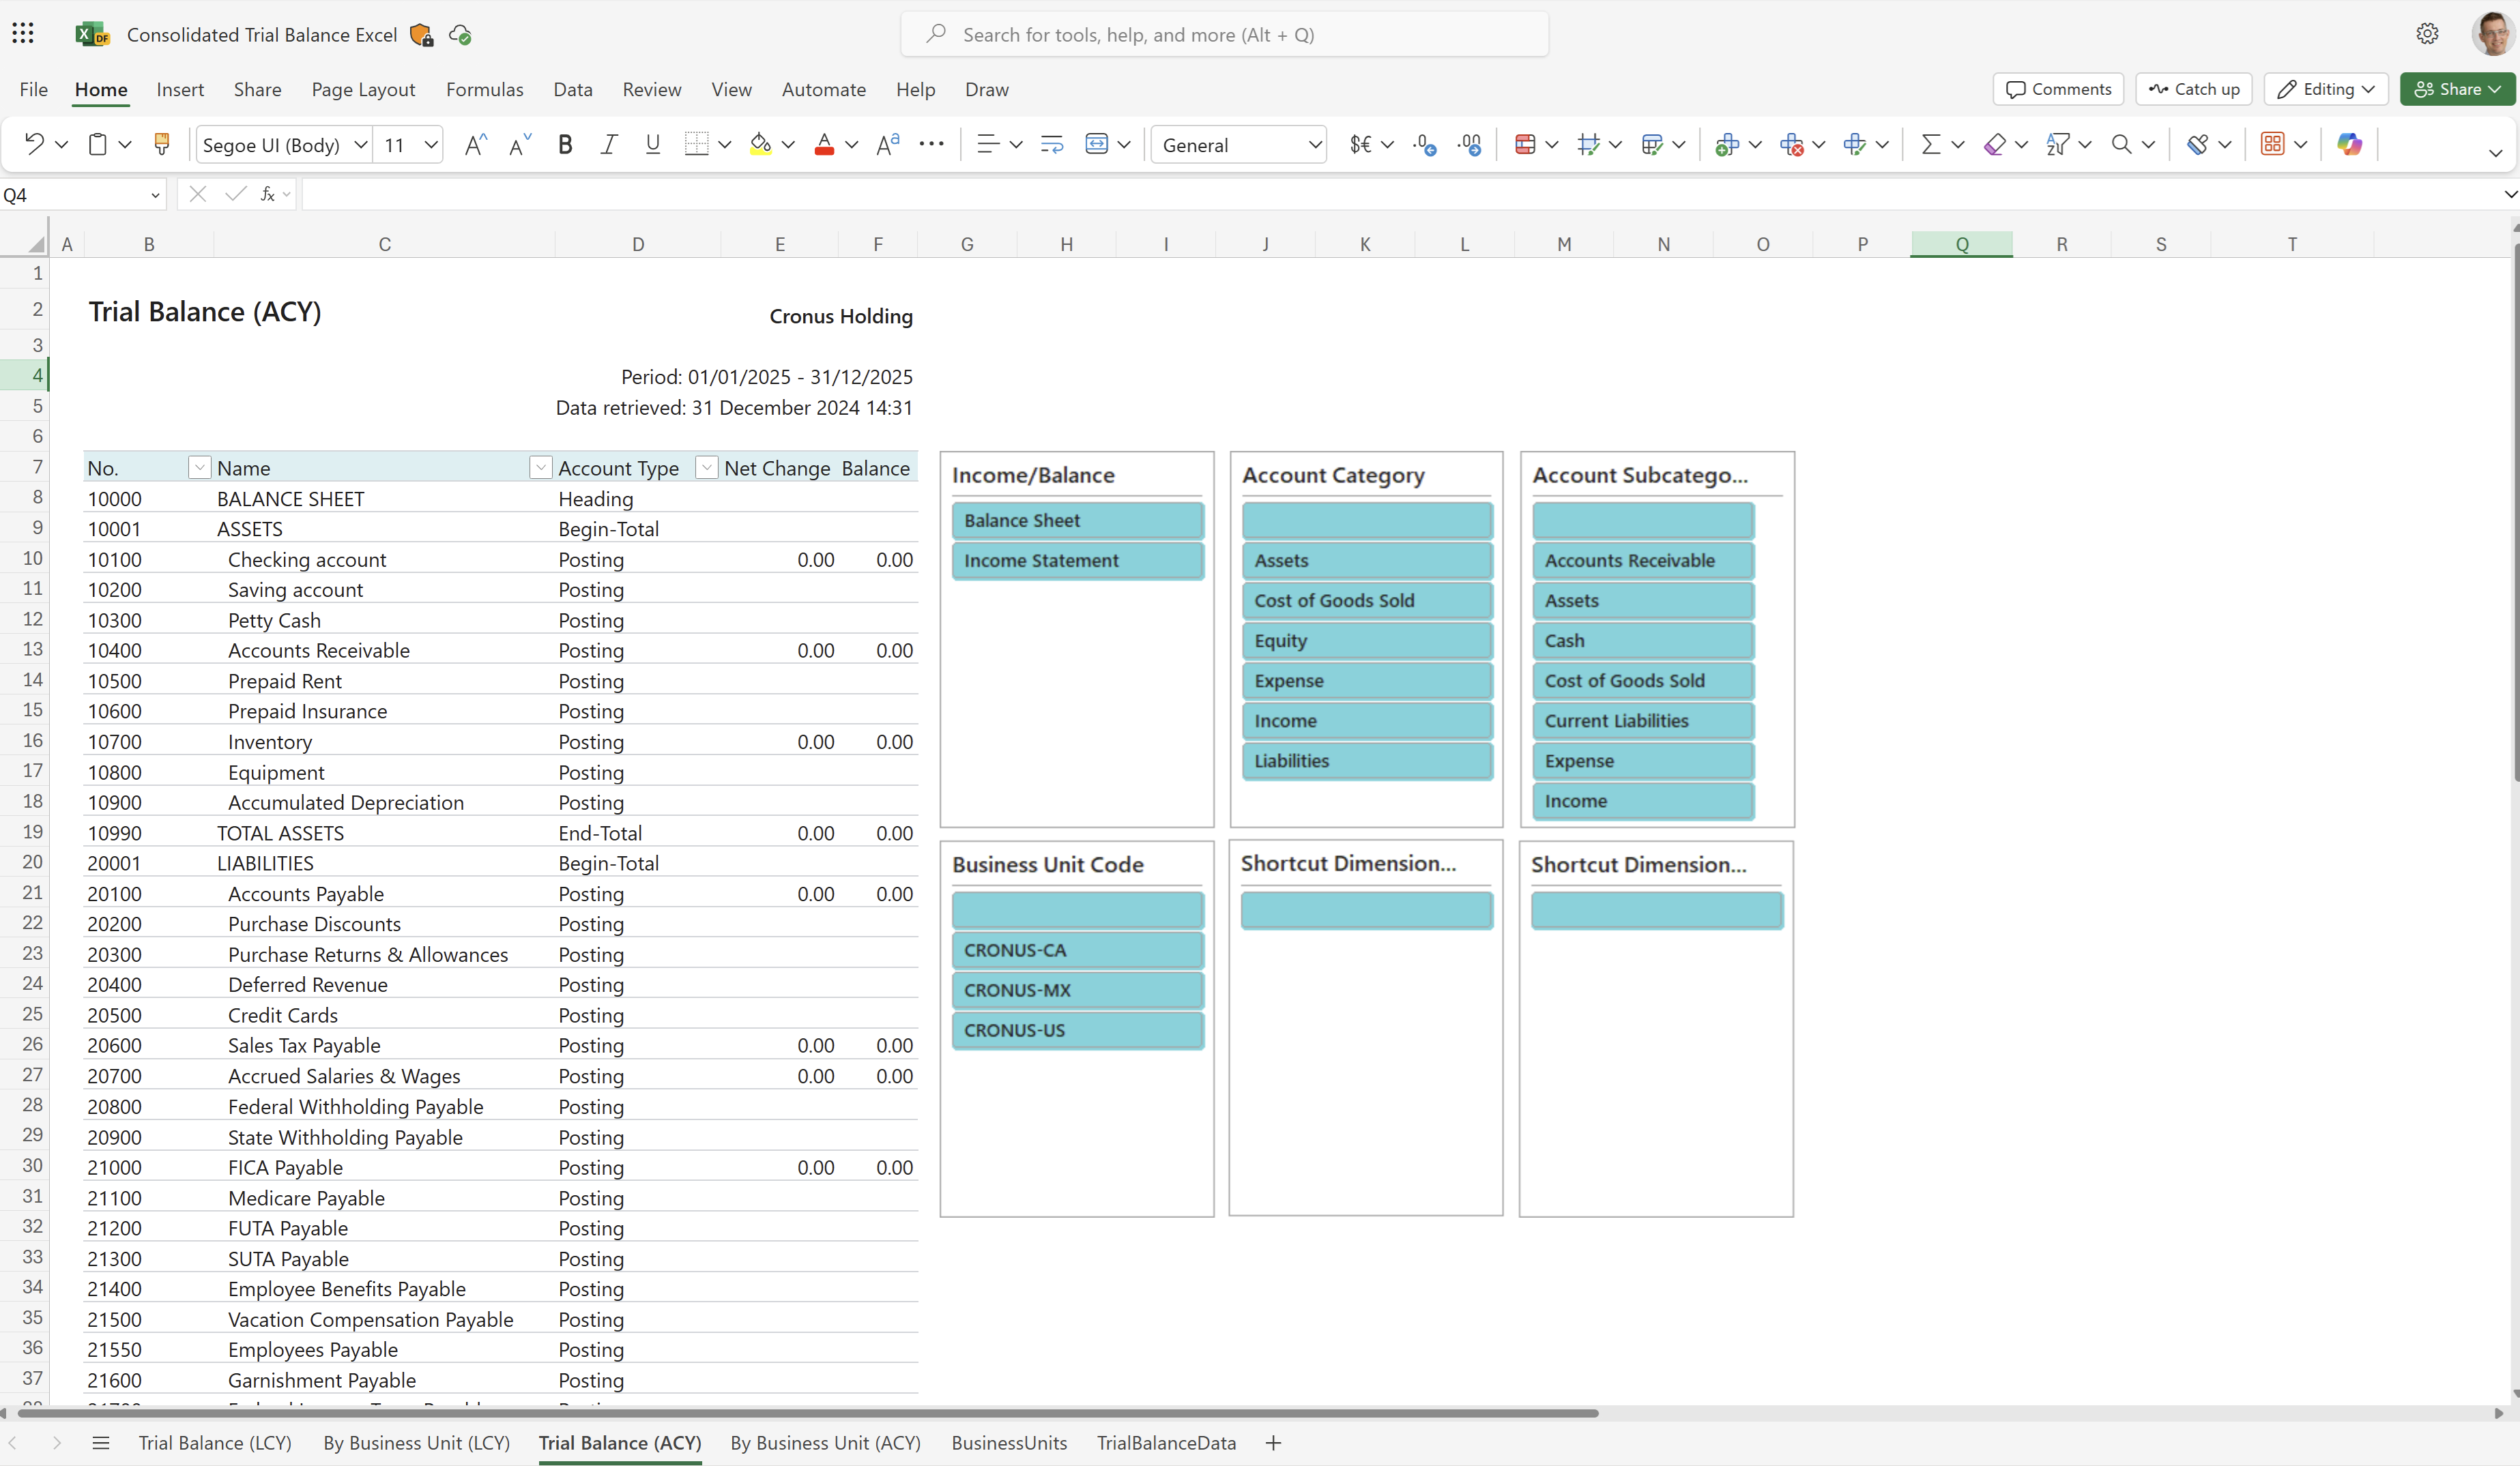
Trial Balance (ACY) worksheet
This worksheet shows the trial balance for the consolidation company with amounts in additional reporting currency (ACY). The report requires that you use ACY. If you don't use ACY, the report doesn't show data.
Tip
Tip:
The data is shown in an Excel pivot table. Choose any cell with data to open the Field List, where you can arrange fields, group or ungroup data, and filter data. To learn more, go to the following articles:
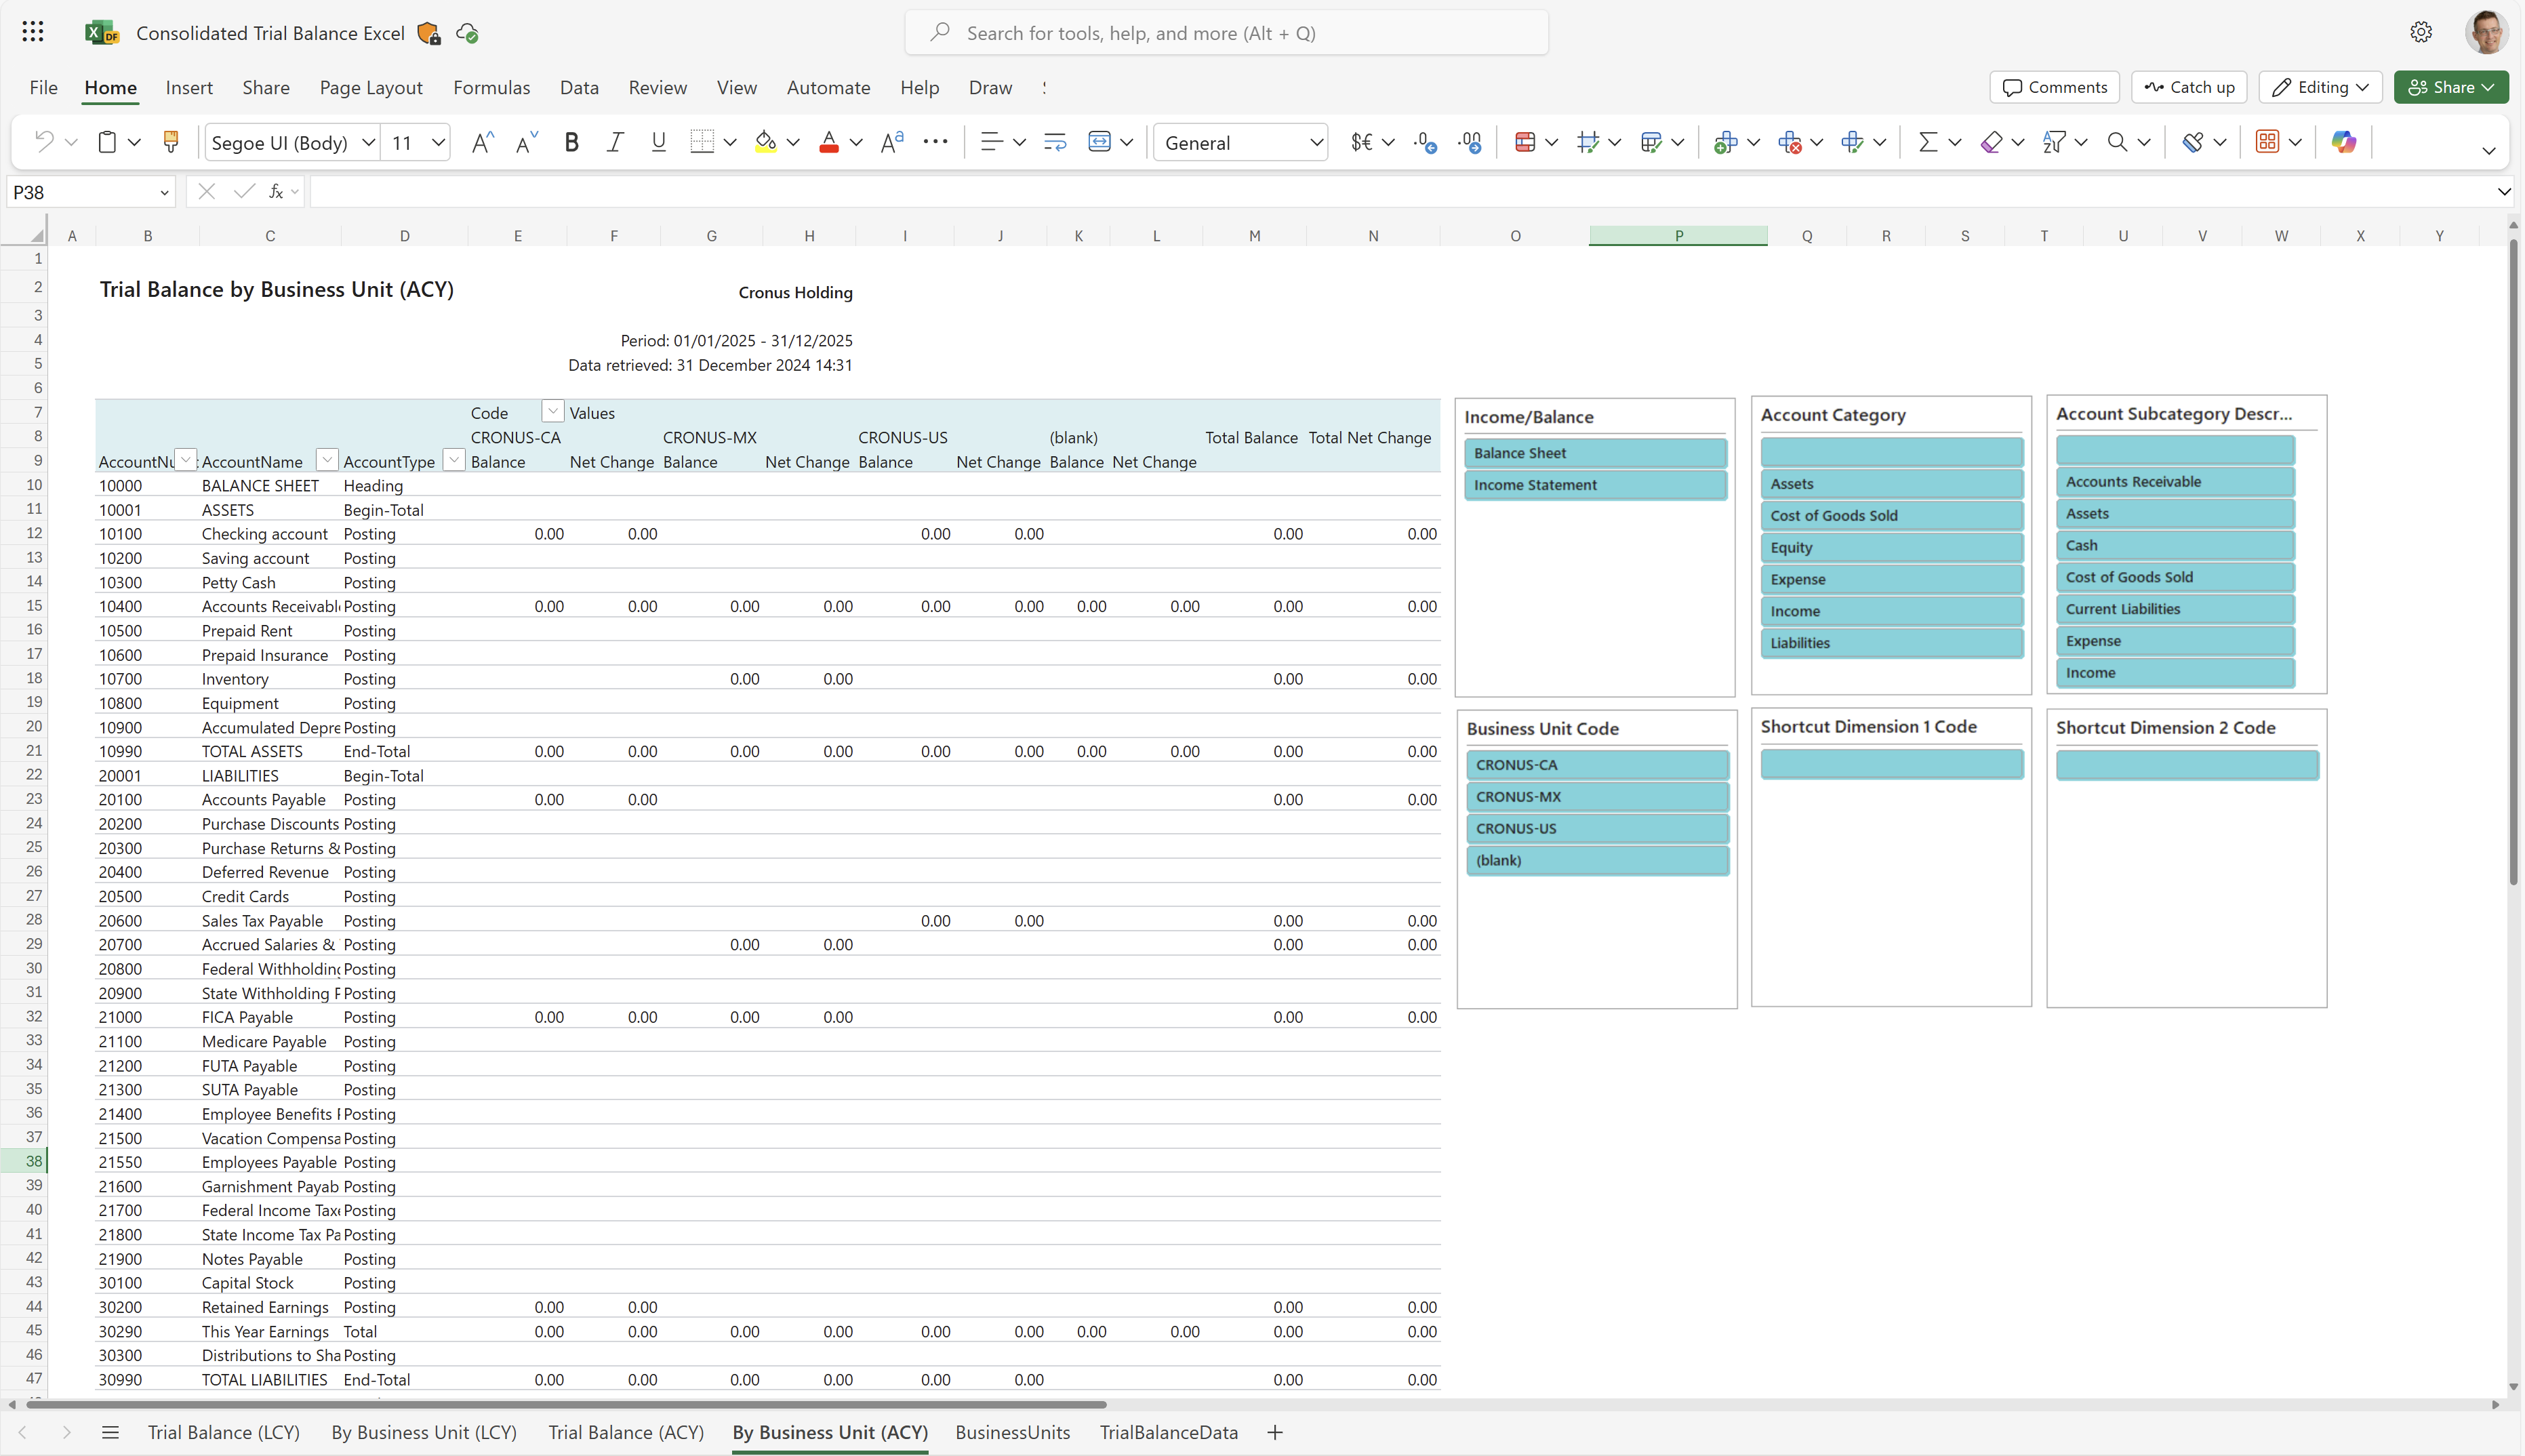
By Business Unit (ACY) worksheet
This worksheet shows the trial balance for the consolidation company with amounts in ACY for your business units.
Tip
Tip:
The data is shown in an Excel pivot table. Choose any cell with data to open the Field List, where you can arrange fields, group or ungroup data, and filter data. To learn more, go to the following articles:
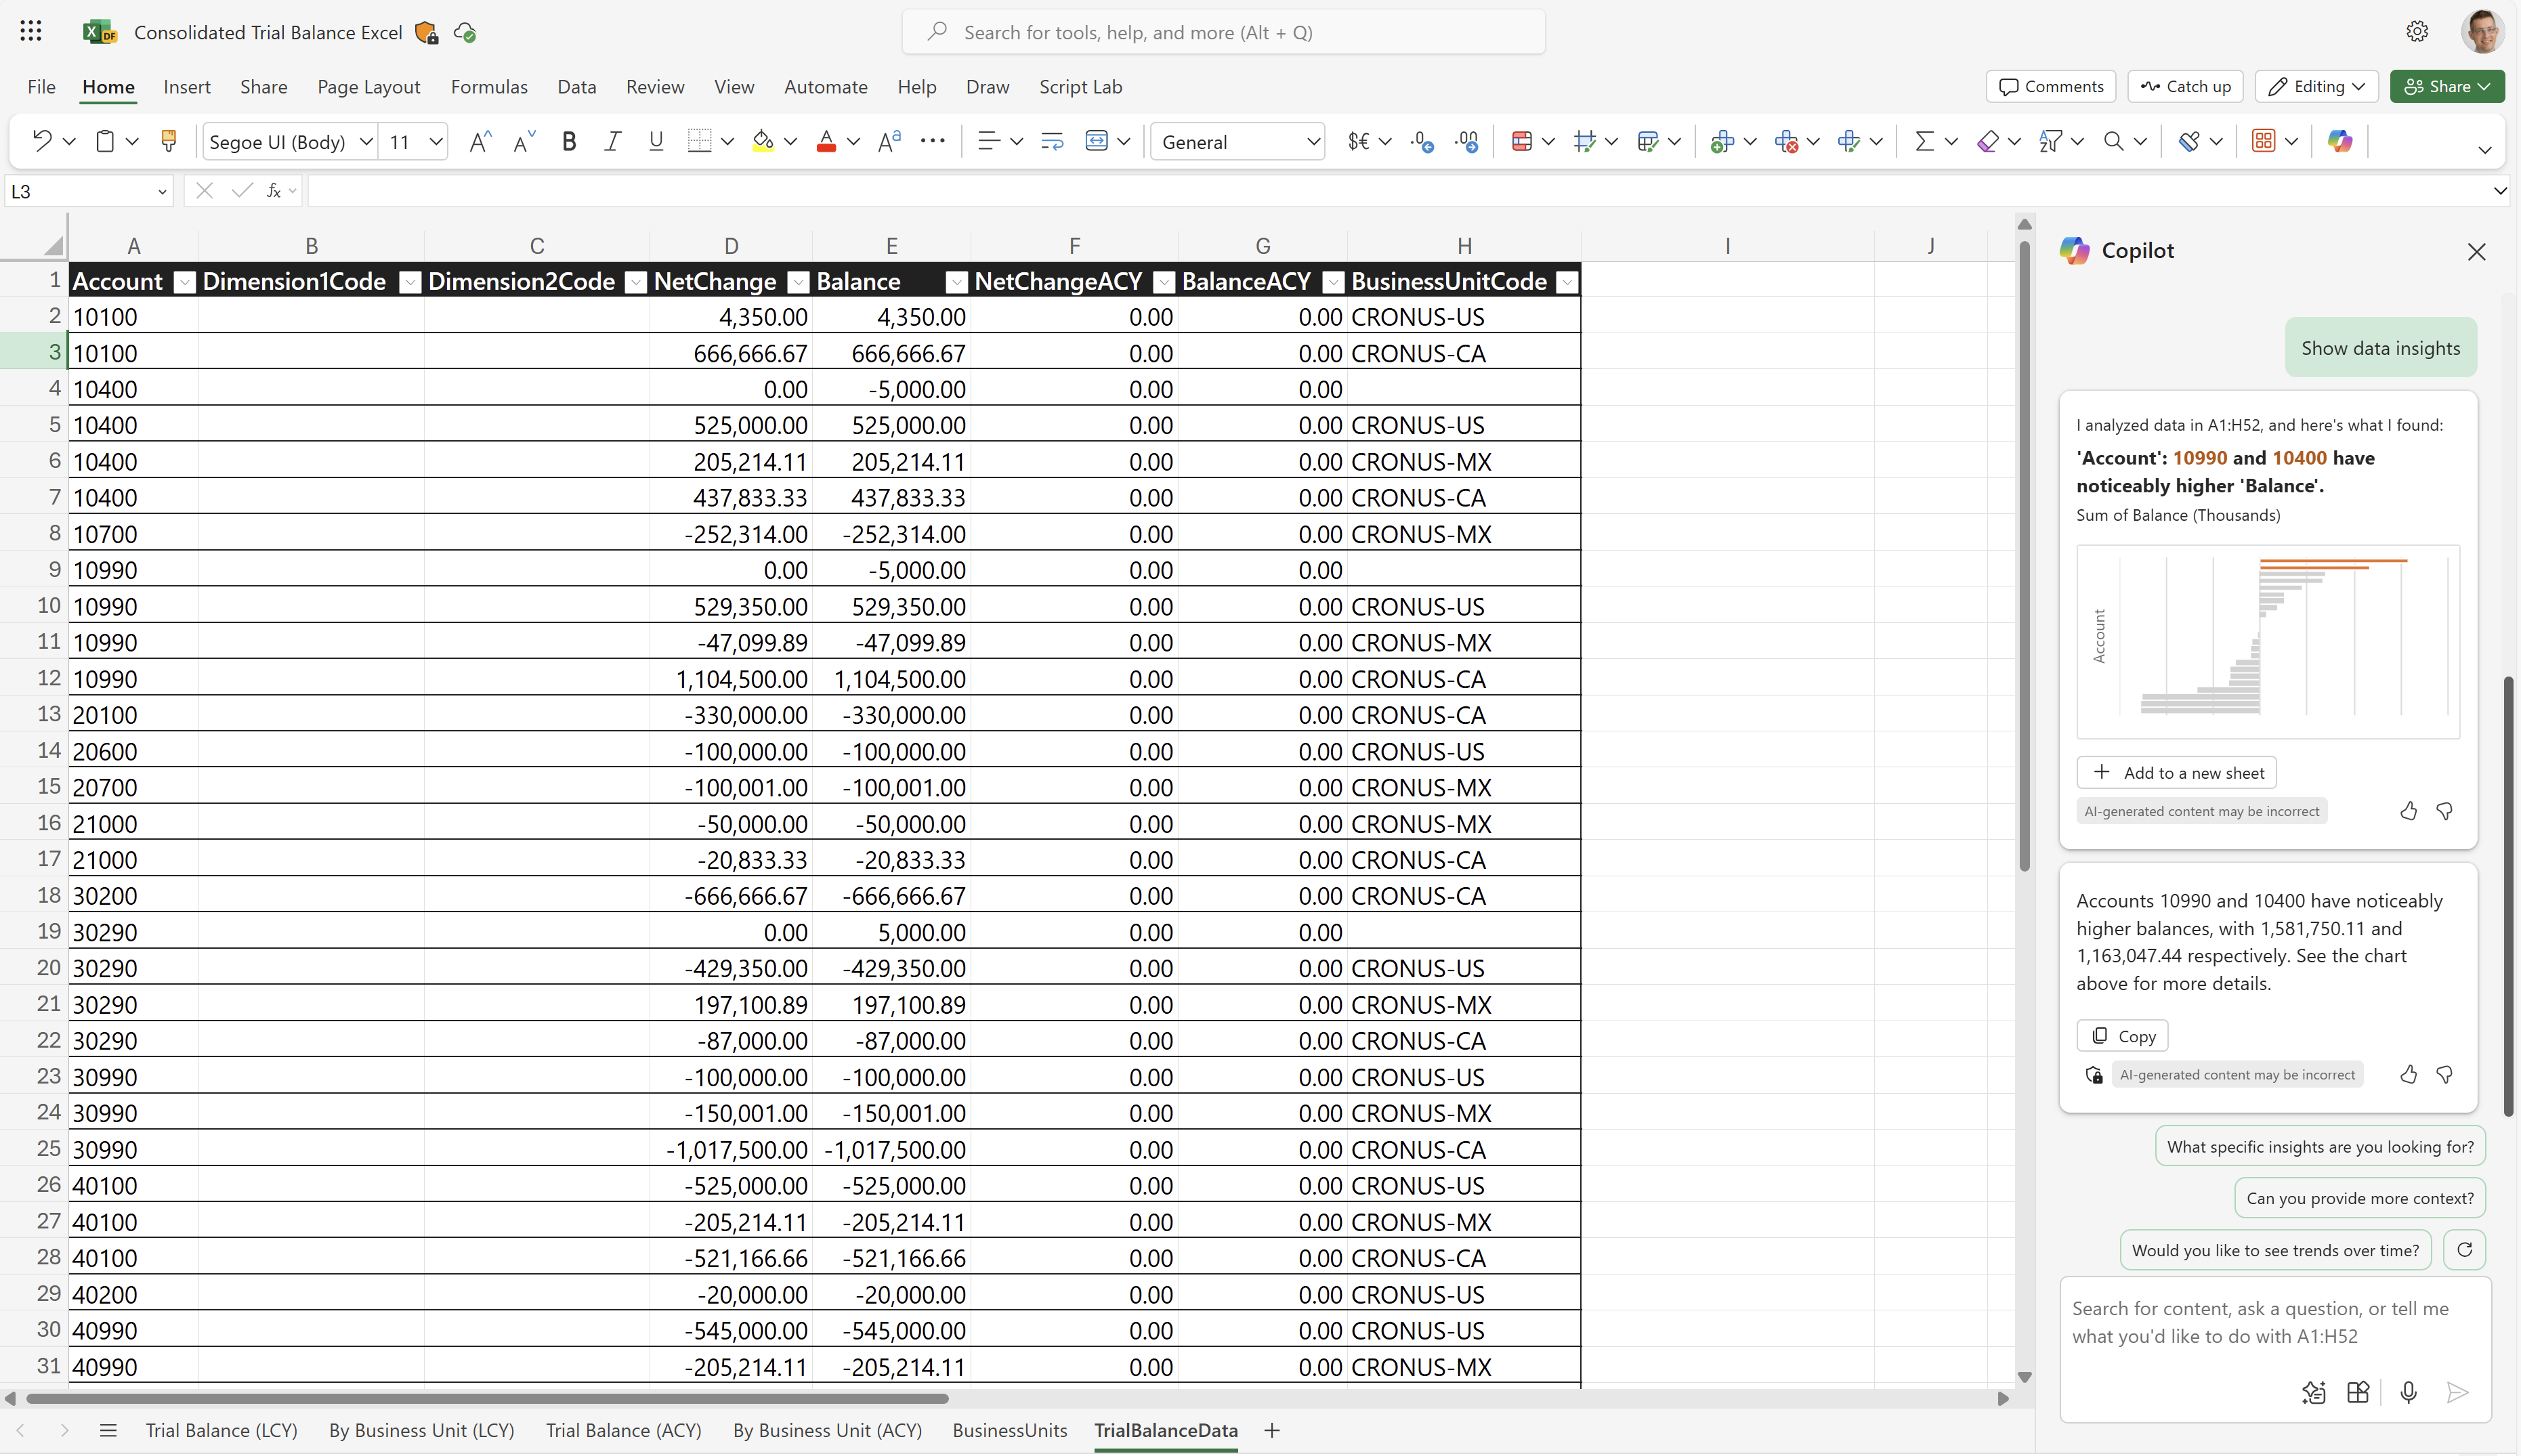
TrialBalanceData worksheet
This worksheet shows the raw data used in the report. The dataset for the report is aggregated, so the worksheet doesn't show individual transactions.
Use this worksheet for data analysis assisted by built-in tools in Excel, such as Excel Copilot, or the What-if-analysis or Forecast Sheet tools.
To learn more, go to Get started with Copilot in Excel.
Other worksheets
The Business Central platform always adds three system worksheets to Excel reports:
- TranslationData, with text needed for multi-language reports.
- CaptionData, with text from Business Central fields needed for multi-language reports
- Aggregated Metadata, with data about the report, and when and how it was run.
All three worksheets are hidden by default. To learn more, go to System Excel workbooks in the developer documentation.
Use cases
Use Excel to view a snapshot of your consolidated chart of accounts at a given point to check the debit and credit net change and closing balance.
Try the report
Try the report here: Consolidated Trial Balance Excel
Tip
Tip:
If you hold down the CTRL key while you select the report link, the report opens on a new browser tab. In this way, you can stay on the current page while you explore the report on the other browser tab.
Make the report your own
You can create your own report layouts with Excel, either from scratch or based on an existing layout. To modify the layout for the report, export the layout (not the workbook that resulted from running the report) from Business Central, make your changes, and then import the layout into Business Central.
To learn more, go to Task 1: Create the Excel layout file.
Alternative reports
There are several other ways to analyze your balance. To learn more, go to:
Contributors
Microsoft maintains this article. The following contributors provided some or all of its contents.
- Kim Dallefeld | Microsoft MVP
- Steve Chinsky | Microsoft MVP
- Rob Delprado | Microsoft MVP
Related information
Set Up Company Consolidation
Balance Sheet (Power BI)
Key finance report overview
Ad hoc analysis on finance data
Power BI finance app
Financial Reporting
Financial analytics overview