Production Scrap (Power BI Report)
APPLIES TO: Generally available in Business Central 2024 release wave 2.
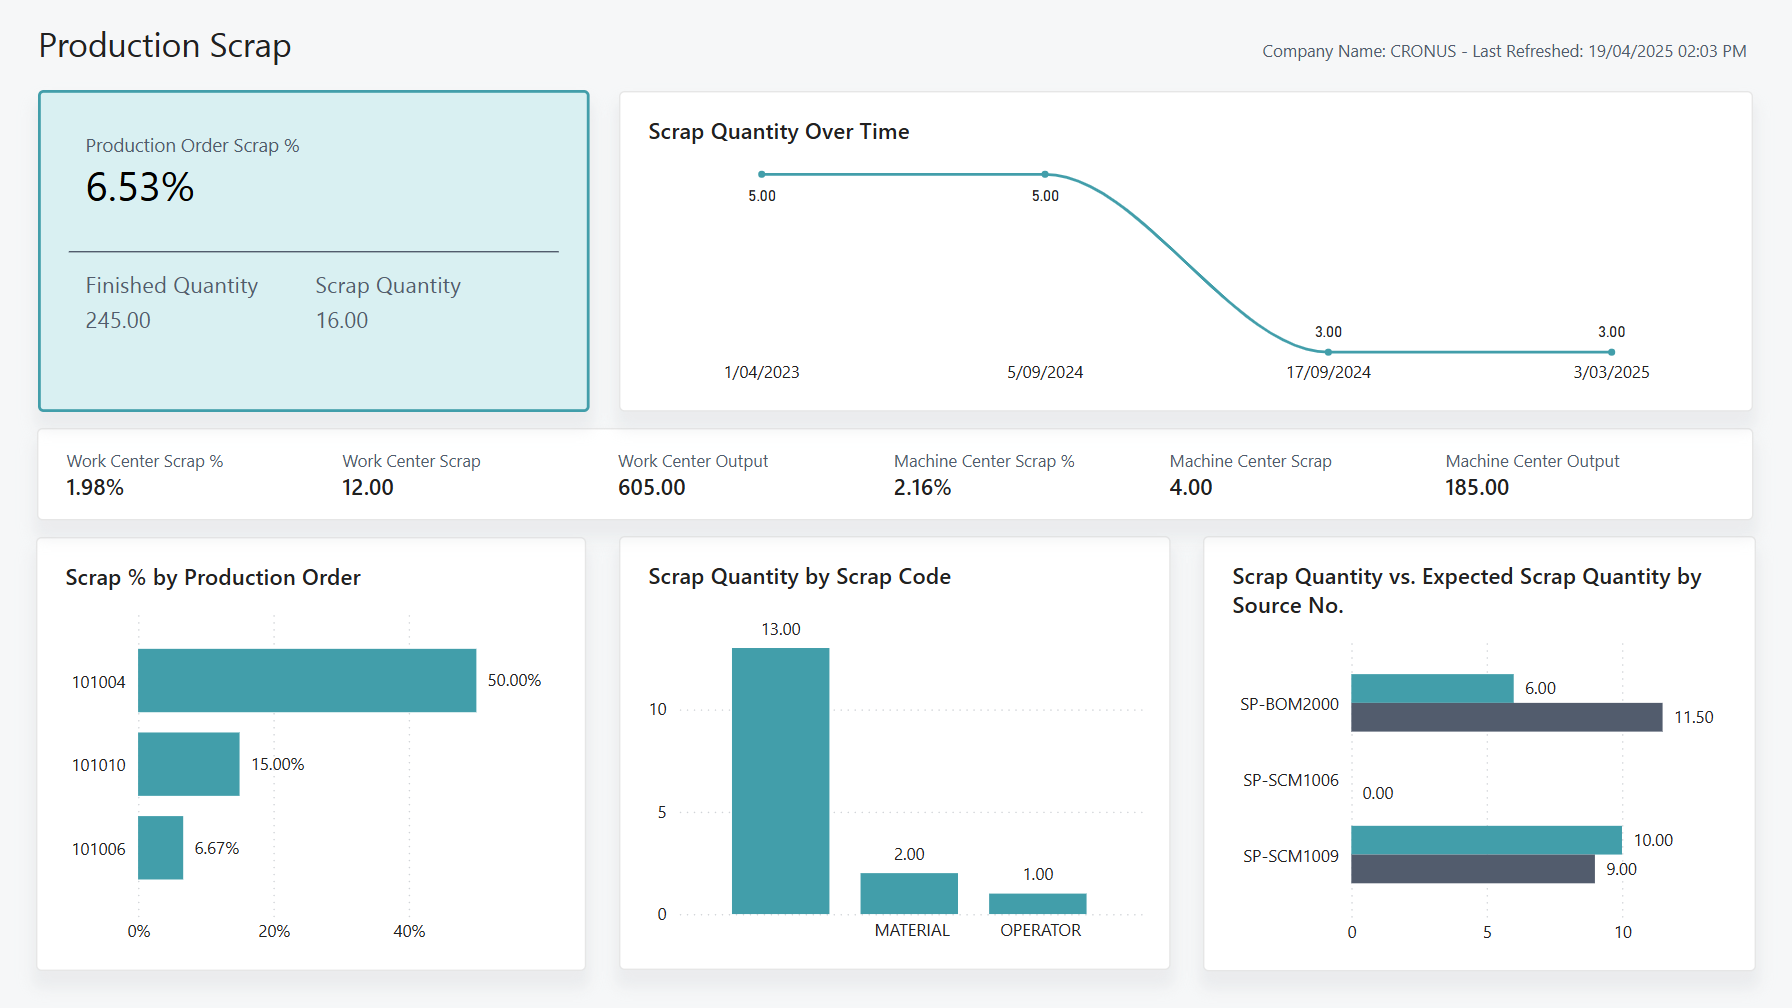
The Production Scrap report presents important key performance indicators (KPIs) such as Scrap % and Scrap Quantity by Work Center, Machine Center, Source No., and Production Order.
The Production Order Scrap % KPI card highlights the relationship between Finished Quantity and Scrap Quantity to help clarify the drivers behind the production order scrap percent.
The Scrap Quantity Over Time chart shows how scrap quantity changes over time. This chart allows you to identify trends in production scrap as processes change.
Work center and machine center statistics display in the KPI Bar. Work Center Scrap % and Machine Center Scrap % are derived from the Work Center Scrap and Work Center Output respectively. These figures help you understand the efficiency of your production facilities at a glance.
The Scrap % by Production Order chart gives you an easy way to compare scrap rates across different productions orders. Cross filter this report by the Scrap Quantity vs. Expected Scrap Quantity by Source No. chart to identify which production orders contribute to the scrap rate.
The Scrap Quantity by Scrap Code visual allows you to quickly compare and analyze why scrap occurred.
Used together, these visuals help uncover where and why waste is happening, so you can take steps to reduce it.
Use the report
The report is meant for business leaders and manufacturing managers.
COOs use the report to measure the effectiveness of manufacturing processes and resources. By analyzing the capacity scrap quantity, you can identify areas that need improvement and optimize resource use. For example, a high scrap rate at a particular location might indicate a problem with the machinery or the materials it uses. By addressing these issues, you can reduce waste and improve efficiency, leading to cost savings.
For manufacturing managers, this report reveals important measures about capacity scrap quantity. By analyzing the scrap rate, you can identify areas that need improvement, such as processes or materials. For example, a high scrap rate for a particular item category might indicate a problem with the materials it uses. By addressing these issues, you can optimize resource use to reduce waste and save costs.
Key performance indicators (KPIs)
The Production Scrap report includes the following KPIs and measures:
- Production Order Scrap %
- Finished Quantity
- Scrap Quantity
- Work Center Scrap %
- Work Center Scrap
- Work Center Output
- Machine Center Scrap %
- Machine Center Scrap
- Machine Center Output
- Expected Production Order Scrap Quantity
Click on the link for a KPI to learn more about what it means, how it is calculated, and what data was used in the calculations.
Tip
Tip:
You can easily track the KPIs that the Power BI reports display against your business objectives. To learn more, go to Track your business KPIs with Power BI metrics.
Data used in the report
The report uses data from the following tables in Business Central:
- Capacity Ledger Entry
- Production Order
- Machine Center
- Work Center
Try the report
Try the report here: Production Scrap
Tip
Tip:
If you hold down the CTRL key while you select the report link, the report opens on a new browser tab. In this way, you can stay on the current page while you explore the report on the other browser tab.
Related information
Track your business KPIs with Power BI metrics
Power BI Manufacturing app
Built-in production reports
Manufacturing overview