Capacity Variance (Power BI Report)
APPLIES TO: Generally available in Business Central 2024 release wave 2.
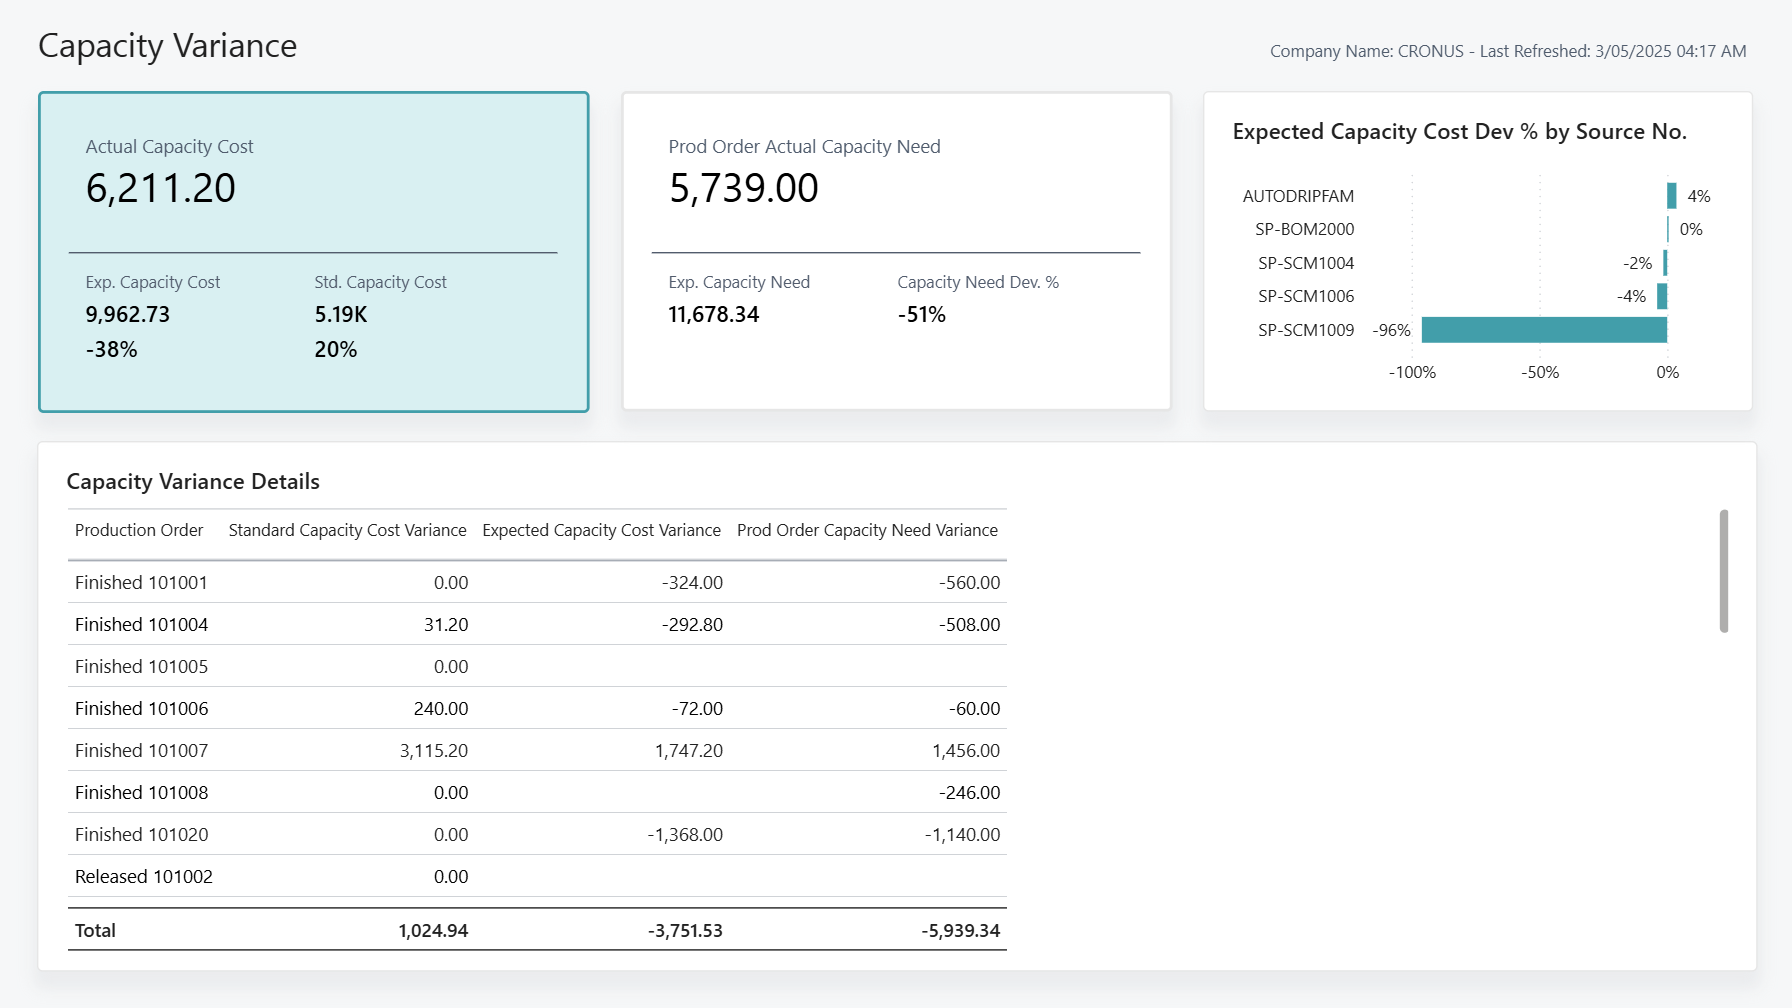
The Capacity Variance report gives an overview of the variance between expected and actual capacity costs on a monthly basis. This report helps you identify areas where costs are overrunning. You can optimize production processes, reduce costs, and improve overall performance.
Use the report
The report is meant for manufacturing managers and supervisors.
Manufacturing managers use the report to track and manage capacity costs for production operations. By analyzing the variance between expected and actual capacity costs on a monthly basis, you can find areas where costs are overrunning and take corrective action.
Production supervisors use this report to monitor the performance of production lines and ensure they operate within budget. By tracking the actual capacity costs against the expected costs, you can quickly uncover deviations. For example, the report might show that the cost of raw materials increased significantly. You can investigate whether the issue is due to supplier pricing or production inefficiencies.
Key Performance Indicators (KPIs)
The Capacity Variance report includes the following KPIs and measures:
- Actual Capacity Cost
- Expected Capacity Cost
- Standard Capacity Cost
- Expected Capacity Cost Variance
- Standard Capacity Cost Variance
- Expected Capacity Cost Dev %
- Standard Capacity Cost Dev %
- Prod Order Actual Capacity Need
- Prod Order Expected Capacity Need
- Prod Order Need Variance
Click on the link for a KPI to learn more about what it means, how it is calculated, and what data was used in the calculations.
Tip
Tip:
You can easily track the KPIs that the Power BI reports display against your business objectives. To learn more, go to Track your business KPIs with Power BI metrics.
Data used in the report
The report uses data from the following tables in Business Central:
- Production Order Routing Line
- Production Order
- Capacity Ledger Entry
Try the report
Try the report here: Capacity Variance
Tip
Tip:
If you hold down the CTRL key while you select the report link, the report opens on a new browser tab. In this way, you can stay on the current page while you explore the report on the other browser tab.
Related information
Track your business KPIs with Power BI metrics
Power BI Manufacturing app
Built-in production reports
Manufacturing overview