Purchase and Sales Quantity (Power BI Report)
APPLIES TO: Generally available in Business Central 2024 release wave 2.
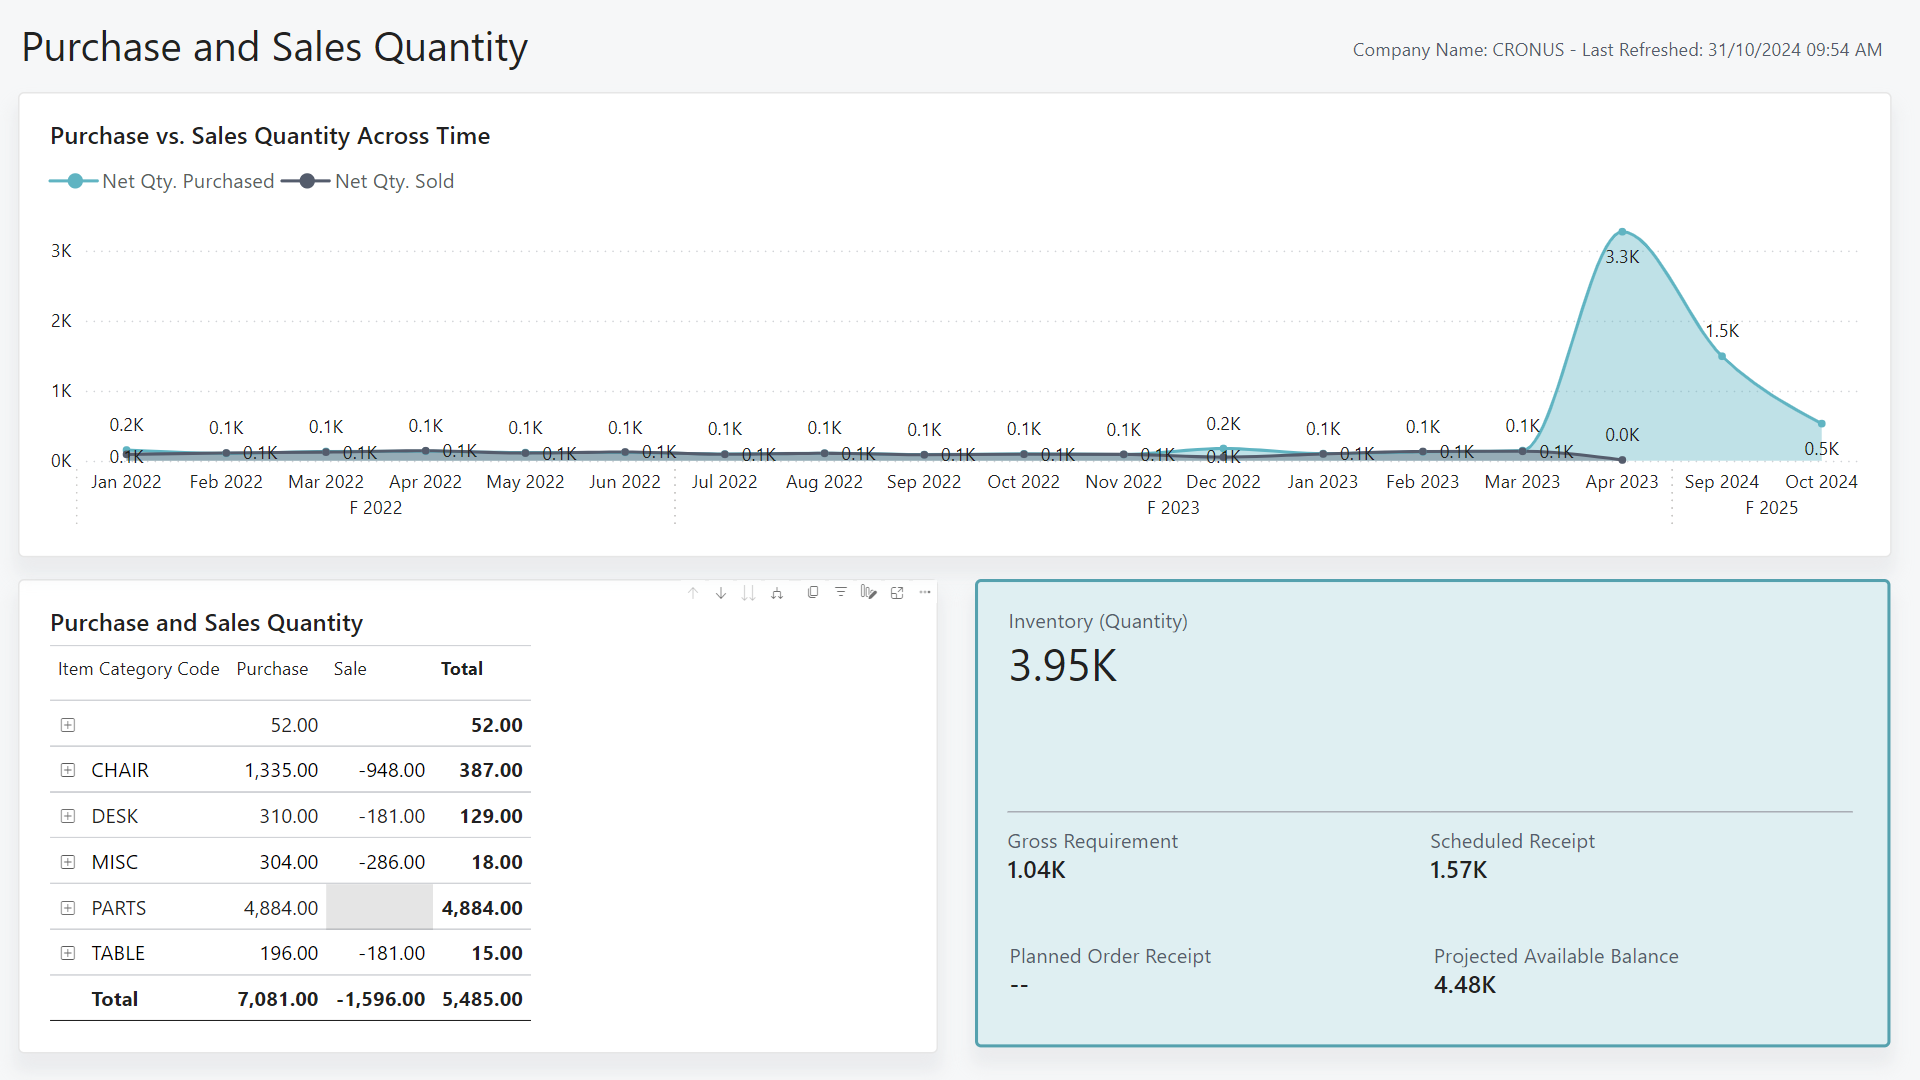
The Purchase and Sales Quantity report shows purchase and sales quantities for an organization. It showcases key sales and purchasing values for each item or item category.
This report is meant for most users and can show any user key data about the ins and outs of items or item categories.
How to use the report
The leadership team and managers use the report to track of the ins and outs of items in the organization. The report helps you ensure that your purchasing efforts meet demand.
The report helps leadership teams make informed strategic planning decisions by offering an overview of purchase and sales quantities.
Managers use the report to track key items. You can identify items that you purchase in large volumes and monitor their sales performance, or find items that you aren't purchasing enough of to keep up with demand.
Key Performance Indicators (KPIs)
The Purchase and Sales Quantity report includes the following KPIs:
- Net Qty. Purchased
- Net Qty. Sold
- Quantity
- Inventory (Quantity)
- Gross Requirement
- Scheduled Receipt
- Planned Order Receipt
- Projected Available Balance
Click on the link for a KPI to learn more about what it means, how it is calculated, and what data was used in the calculations.
Tip
Tip:
You can easily track the KPIs that the Power BI reports display against your business objectives. To learn more, go to Track your business KPIs with Power BI metrics.
Data used in the report
The report uses data from the following tables in Business Central:
- Item
- Item Ledger Entries
Try the report
Try the report here: Purchase and Sales Quantity
Tip
Tip:
If you hold down the CTRL key while you select the report link, the report opens on a new browser tab. In this way, you can stay on the current page while you explore the report on the other browser tab.
Related information
Track KPIs with Power BI metrics
Power BI Inventory app
Ad hoc analysis of inventory data
Built-in inventory and warehouse reports
Inventory analytics overview
Inventory overview