Bin Contents (Power BI Report)
APPLIES TO: Generally available in Business Central 2024 release wave 2.
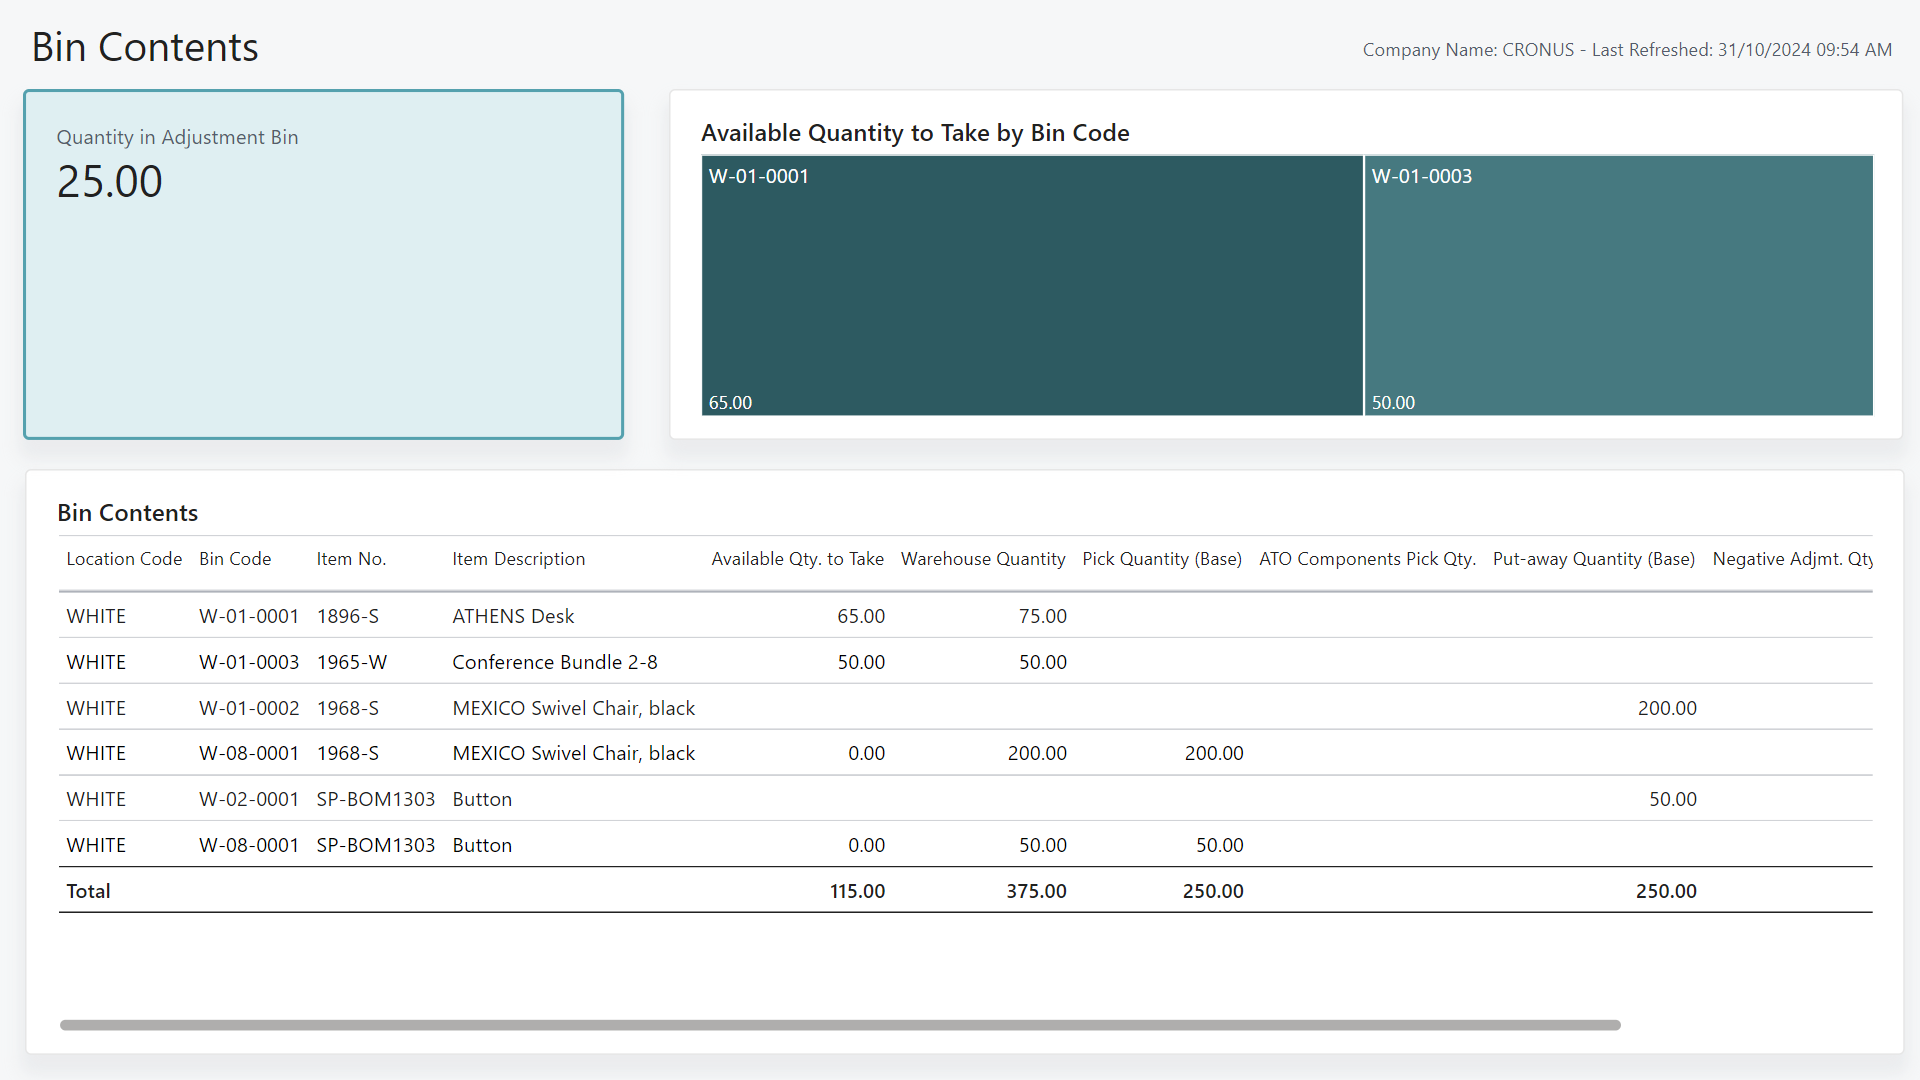
The Bin Contents report breaks down an organization's inventory levels on a bin-by-bin basis. Use this information to identify high and low volume bins and inform inventory movement requirements if bins need more inventory.
The report also shows the available quantity and quantity metrics across different warehouse activities. For example, picks, put-aways, and general adjustments.
Use the report
The report helps managers and manufacturing or procurement staff to identify item volumes in each bin.
For warehouse or inventory managers, the report provides a clear picture of the stock levels of each bin across your organization. The report can help you make decisions on procurement or production. It might also prompt you to transfer stock to a specific bin to maintain supply.
Manufacturing team members can use this report to gauge inventory levels across all bins and plan production schedules based on the inventory in each bin.
The procurement team can use this report to gauge inventory levels across all bins and plan purchase orders to ensure that quantities in bins stay at a reasonable level.
Key Performance Indicators (KPIs)
The Bin Contents report includes the following KPIs:
- Quantity in Adjustment Bin
- Available Quantity to Take
- Warehouse Quantity
- Pick Quantity (Base)
- ATO Components Pick Qty.
- Put-Away Quantity (Base)
- Negative Adjmt. Qty. (Base)
- Positive Adjmt. Qty. (Base)
Click on the link for a KPI to learn more about what it means, how it is calculated, and what data was used in the calculations.
Tip
Tip:
You can easily track the KPIs that the Power BI reports display against your business objectives. To learn more, go to Track your business KPIs with Power BI metrics.
Data used in the report
The report uses data from the following tables in Business Central:
- Item
- Bin
- Location
- Item Ledger Entries
- Warehouse Entries
- Warehouse Activity Lines
- Warehouse Journal Lines
- Zone
Try the report
Try the report here: Bin Contents
Tip
Tip:
If you hold down the CTRL key while you select the report link, the report opens on a new browser tab. In this way, you can stay on the current page while you explore the report on the other browser tab.
Related information
Track KPIs with Power BI metrics
Power BI Inventory app
Ad hoc analysis of inventory data
Built-in inventory and warehouse reports
Inventory analytics overview
Inventory overview