Sales Forecasting (Power BI Report)
APPLIES TO: Business Central 2025 release wave 2 and later.
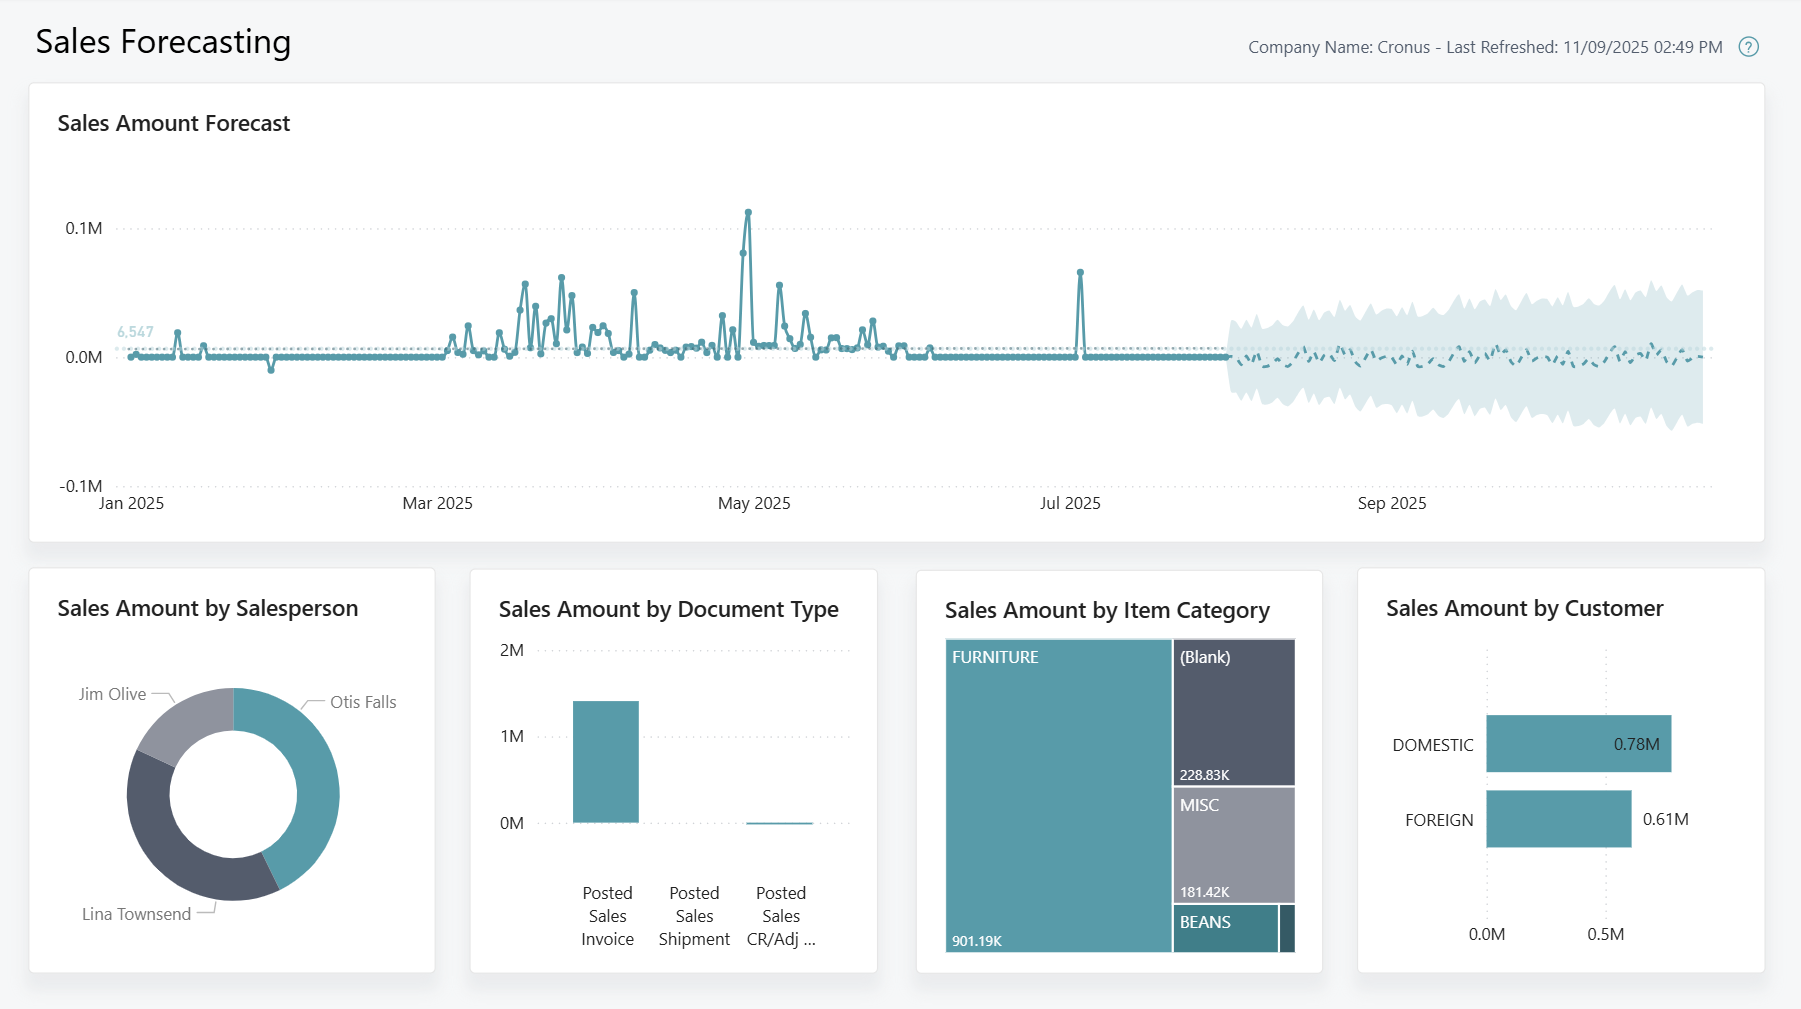
The Sales Forecasting report predicts future sales trends based on historical data. The report uses advanced forecasting techniques to project sales values across customer, document type, item, and salesperson dimensions to help you anticipate demand and future profits.
The sales forecasting visualization predicts the next three months of purchases based on the previous six months, assuming a monthly seasonality.
Note
You can customize the default forecasting options in the Forecast section of the Analytics pane in Power BI Desktop. For example, you can modify the forecast length, seasonality, period, and confidence interval.
Use the report
Leadership, sales managers, and salespeople can use this report to anticipate stock requirements and predicted sales performance for the organization.
CEOs need to anticipate sales trends to implement strategies based on forecasted sales metrics and predicted financial impacts. For example, you identify that sales are predicted to decrease in a future month. Using this knowledge, you invest in marketing strategies to drive future sales and maintain consistent income.
Sales managers need to monitor projected sales to anticipate product demand and manage workload of their salespeople. Using the sales by item visual, you foresee higher demand for an item in the upcoming months. In response, you communicate with the purchasing team to plan sufficient inventory availability for that item and avoid stockouts. Additionally, the sales by salesperson visual might highlight a salesperson who is predicted to be over-utilized in the next week. Using this information, you redistribute workload accordingly to available salespeople, improving wellbeing and productivity.
Salespeople want to track customer sales patterns to effectively manage customer relations. For example, using the sales by customer visual you identify a customer is projected to increase sales in a future month. In response, you proactively engage with the customer to encourage sales and maintain an effective customer relationship.
Key Performance Indicators (KPIs)
The Sales Forecasting report includes the following KPIs and measures:
Click on the link for a KPI to learn more about what it means, how it is calculated, and what data was used in the calculations.
Tip
Tip:
You can easily track the KPIs that the Power BI reports display against your business objectives. To learn more, go to Track your business KPIs with Power BI metrics.
Data used in the report
The report uses data from the following tables:
- Sales Value Entries
- Sales Invoice Lines
- Sales Credit Lines
- Project Ledger Entries
- Salesperson/Purchaser
- Item
- Customer
Try the report
Try the report here: Sales Forecasting
Tip
Tip:
If you hold down the CTRL key while you select the report link, the report opens on a new browser tab. In this way, you can stay on the current page while you explore the report on the other browser tab.
Related information
Track your business KPIs with Power BI metrics
Ad-hoc analysis of sales data
Built-in sales reports
Sales analytics overview
Sales overview