Sales Demographics (Power BI Report)
APPLIES TO: Generally available in Business Central 2025 release wave 1 (version 26.x).
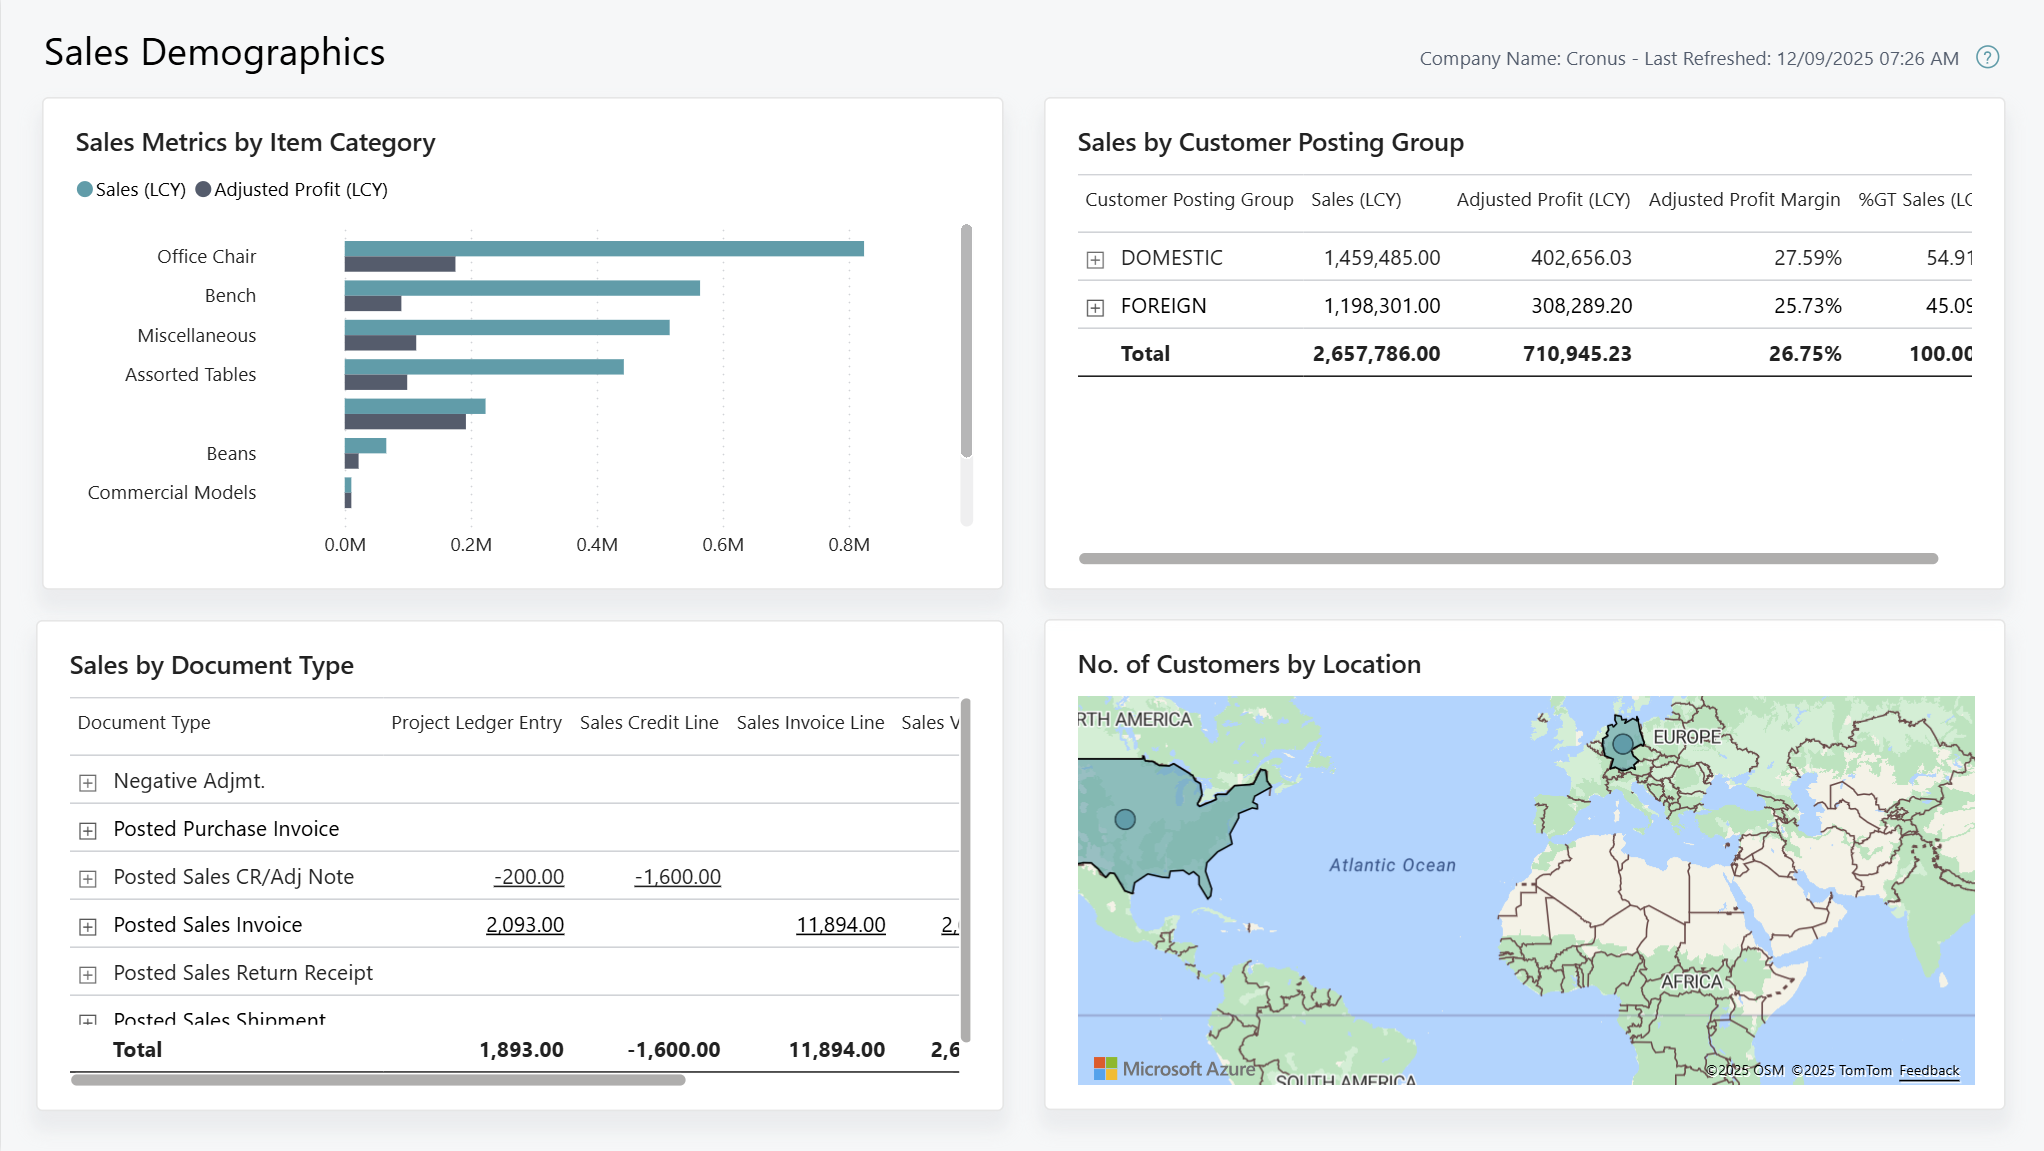
The Sales Demographics report provides a comprehensive analysis of sales performance across demographic segments. The report offers valuable insights into customer behavior and preferences that can help you optimize sales strategies.
Use the report
Leadership and management teams use the report to to gain a deeper understanding of sales performance based on demographic factors. This report is helpful for analyzing sales metrics by item category, customer posting group, document type, and geographical location to identify trends and opportunities for growth.
CEOs want to understand how demographic factors including item categories, posting groups or geographical regions impact sales performance.
By analyzing the report, you discover that domestic customers in urban areas account for 60% of your total sales. Also, the report uncovers that one region is underperforming compared to another, despite similar product offerings. Armed with this data, you decide to allocate more marketing budget and strategize a new promotional campaign to increase sales.
Sales managers want to ensure that the team meets its revenue targets. You want to monitor sales performance across different customer segments and make data-driven adjustments to your sales strategy.
Using the report, you might find out that customers in the Corporate customer posting group are contributing significantly more to overall revenue than customers in Retail. Additionally, you might find that sales orders for ergonomic chairs are growing faster than leather office chairs. You use this information to direct your sales team to focus on up-selling ergonomic chairs to corporate clients.
Key Performance Indicators (KPIs)
The Sales Demographics report includes the following KPIs and measures:
Click on the link for a KPI to learn more about what it means, how it is calculated, and what data was used in the calculations.
Tip
Tip:
You can easily track the KPIs that the Power BI reports display against your business objectives. To learn more, go to Track your business KPIs with Power BI metrics.
Data used in the report
The report uses data from the following tables:
- Sales Value Entries
- Sales Invoice Lines
- Sales Credit Lines
- Project Ledger Entries
- Customer
- Item
- Resource
- G/L Account
Try the report
Try the report here: Sales Demographics
Tip
Tip:
If you hold down the CTRL key while you select the report link, the report opens on a new browser tab. In this way, you can stay on the current page while you explore the report on the other browser tab.
Related information
Track your business KPIs with Power BI metrics
Ad-hoc analysis of sales data
Built-in sales reports
Sales analytics overview
Sales overview