Sales by Project (Power BI Report)
APPLIES TO: Business Central 2025 release wave 2 and later.
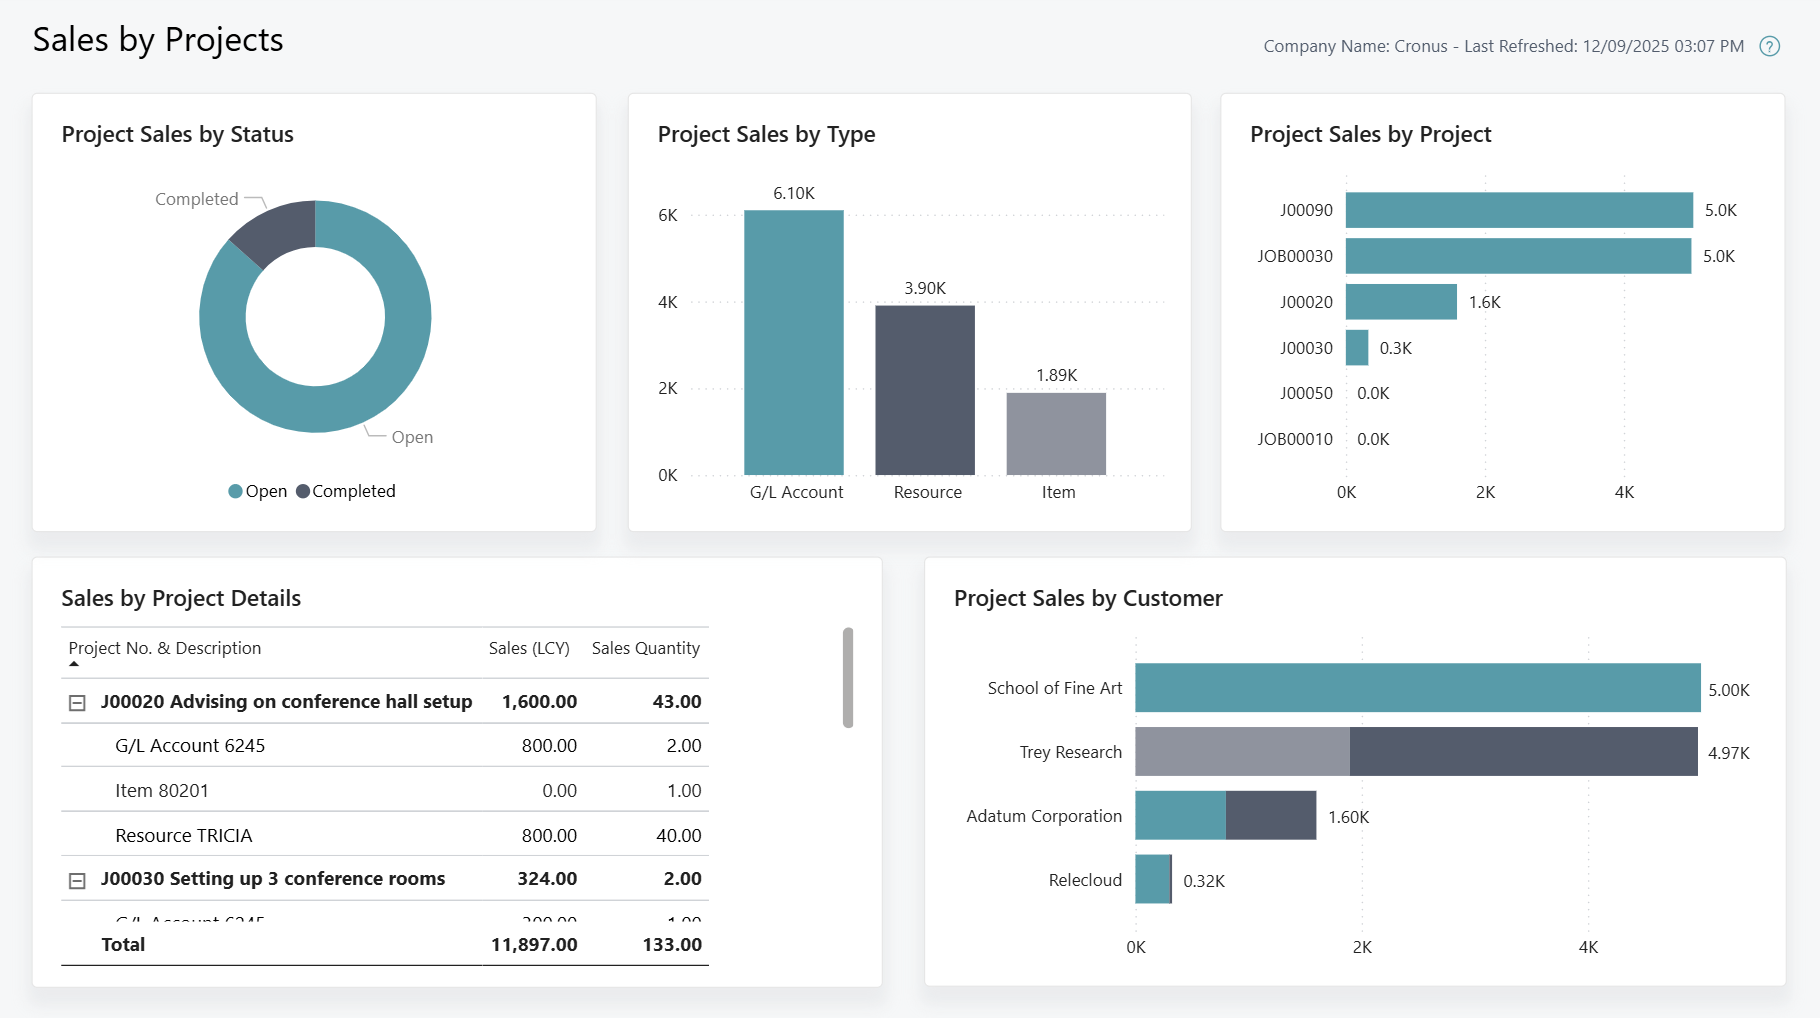
The Sales by Project report provides a high-level overview of sales performance for each project. It showcases key metrics such as total sales amount and quantity for each project and customer. These metrics can be analyzed further through the type dimension, encompassing resources, items, and general ledger accounts.
Use the report
This report helps sales and project management teams to track the sales amounts that each project generates and their contribution to the overall revenue.
Project managers can track the sales impact of projects across key factors, including status, type and customer. By reviewing the project sales by type or by customer, this report provides a high-level overview of project sales performance. You can use these metrics to optimize planning and sales expectations for future project proposals. For more detailed analysis of the underlying project ledger entries, use the cross-report drillthrough to go to the dedicated Power BI Projects app.
Note
To enable cross-report drillthrough, you must publish the source and target reports to the same workspace. Also, the Back button only works for pages in the same report.
Sales managers can use this report to analyze ongoing and completed projects and identify key projects. For example, you might notice an emerging trend in recent projects that contributes to increased sales. In response, you conduct dedicated training to implement new sales strategies to include project offerings, enhancing sales pitches to customers.
Salespeople can monitor the contribution of projects to sales performance and review project sales for individual customers. For example, you identify a recently completed project was highly profitable. Using this information, you initiate new opportunities and engage with customers in similar demographics to empower future sales.
Key performance indicators
The report includes the following key performance indicators (KPIs) and measures:
Click on the link for a KPI to learn more about what it means, how it is calculated, and what data was used in the calculations.
Tip
Tip:
You can easily track the KPIs that the Power BI reports display against your business objectives. To learn more, go to Track your business KPIs with Power BI metrics.
Data used in the report
The report uses data from the following tables:
- Value Entries
- Sales Invoice Lines
- Sales Credit Lines
- Project Ledger Entries
- Customer
- Project
- Item
- G/L Account
- Resource
Try the report
Try the report here: Sales by Project
Tip
Tip:
If you hold down the CTRL key while you select the report link, the report opens on a new browser tab. In this way, you can stay on the current page while you explore the report on the other browser tab.
Related information
Track your business KPIs with Power BI metrics
Ad hoc analysis of sales data
Built-in sales reports
Sales analytics overview
Sales overview