Sales by Location (Power BI Report)
APPLIES TO: Generally available in Business Central 2024 release wave 2.
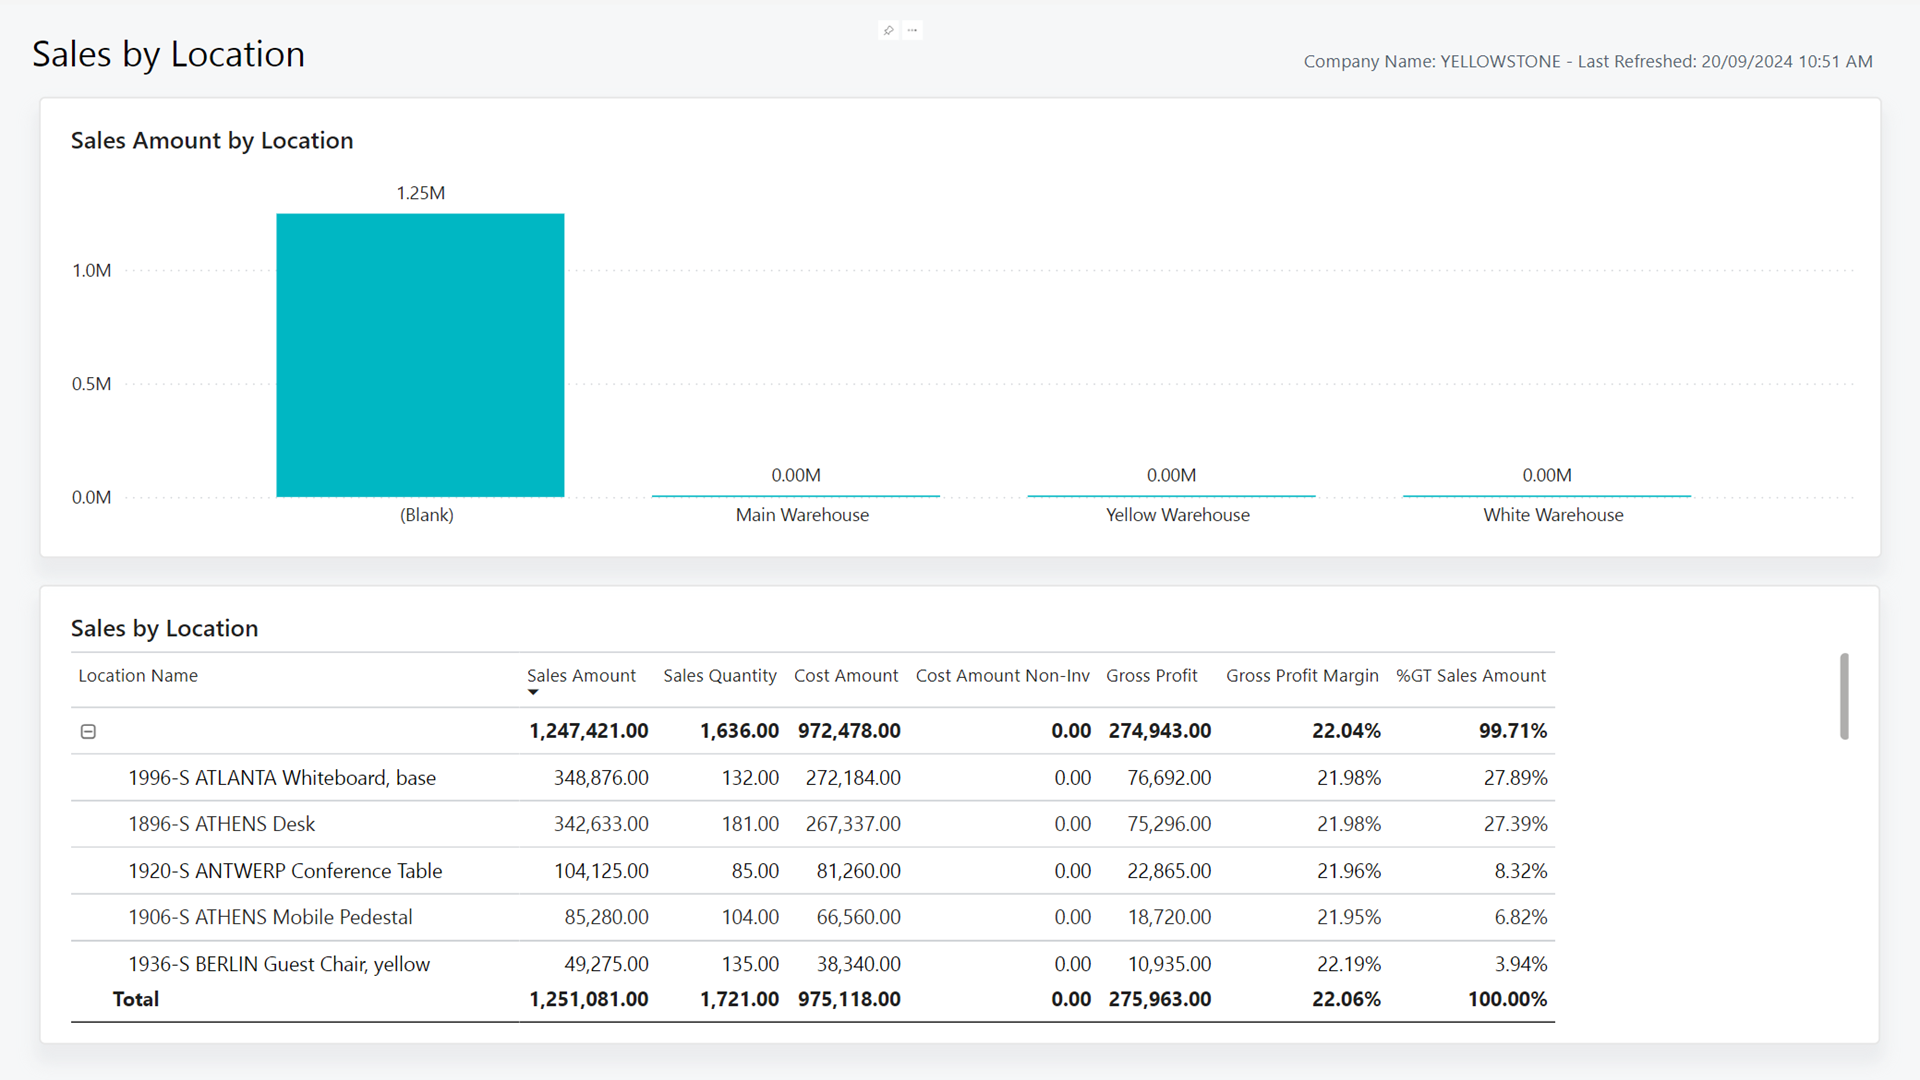
The Sales by Location report provides an overview of sales performance at locations. It showcases key metrics such as total sales amount, total quantity sold, and cost of goods sold. You can break down the metrics further by specific items sold at each location.
Use the report
Leadership and management teams use the report to help them track revenue and cost breakdown per location. The report is valuable for any organization that operates across multiple locations.
For COOs of retail companies with multiple warehouse locations, it's important to have a high-level view of the sales performance of each location. The overview can help you make informed decisions about resource allocation and expansion plans. You can quickly view the total revenue generated by each location and identify under-performing locations. This information helps you make better decisions about resource allocation to ensure that the organization is operating efficiently and effectively across all locations.
Regional managers who oversee several warehouse locations can track revenue and cost breakdown per location, identify areas for improvement, and adjust sales strategies. Analyze the total sales amount, quantity sold, cost of goods sold, and gross profit for each location to find out which locations perform well and which ones need improvement.
Key performance indicators
The report includes the following key performance indicators (KPIs) and measures:
- Sales (LCY)
- Sales Quantity
- Adjusted Cost (LCY)
- Cost Amount Non-Inv
- Adjusted Profit (LCY)
- Adjusted Profit Margin
Click on the link for a KPI to learn more about what it means, how it is calculated, and what data was used in the calculations.
Tip
Tip:
You can easily track the KPIs that the Power BI reports display against your business objectives. To learn more, go to Track your business KPIs with Power BI metrics.
Data used in the report
The report uses data from the following tables:
- Location
- Item
- Sales Value Entries
- Sales Invoice Lines
- Sales Credit Lines
- Project Ledger Entries
Try the report
Try the report here: Sales by Location
Tip
Tip:
If you hold down the CTRL key while you select the report link, the report opens on a new browser tab. In this way, you can stay on the current page while you explore the report on the other browser tab.
Related information
Track your business KPIs with Power BI metrics
Ad hoc analysis of sales data
Built-in sales reports
Sales analytics overview
Sales overview