Fixed Asset Details Excel (report)
The Fixed Asset Details Excel report shows fixed assets ledger entries for one or more fixed assets for a given depreciation book. You can choose to include reversed entries and inactive fixed assets.
The report Excel workbook contains two worksheets that you can use to analyze your fixed assets data:
- Fixed Asset Details
- FixedAssetData
Use the worksheets to analyze data in different ways.
Tip
Tip:
If you configure OneDrive for system features, the Excel workbook opens in your browser in Excel online.
Note
Note:
This report does the calculations when you view it in Excel online, or when you download and open it. If a banner displays text about external data connections, you might need to choose the Enable content button to load data. The report doesn't connect to any external data sources. All calculations are done in Excel with Power Query. In some cases (depending on the security configurations for your organization), you might also need to right-click on a pivot table in one of the worksheets and choose Refresh to update data in the reports.
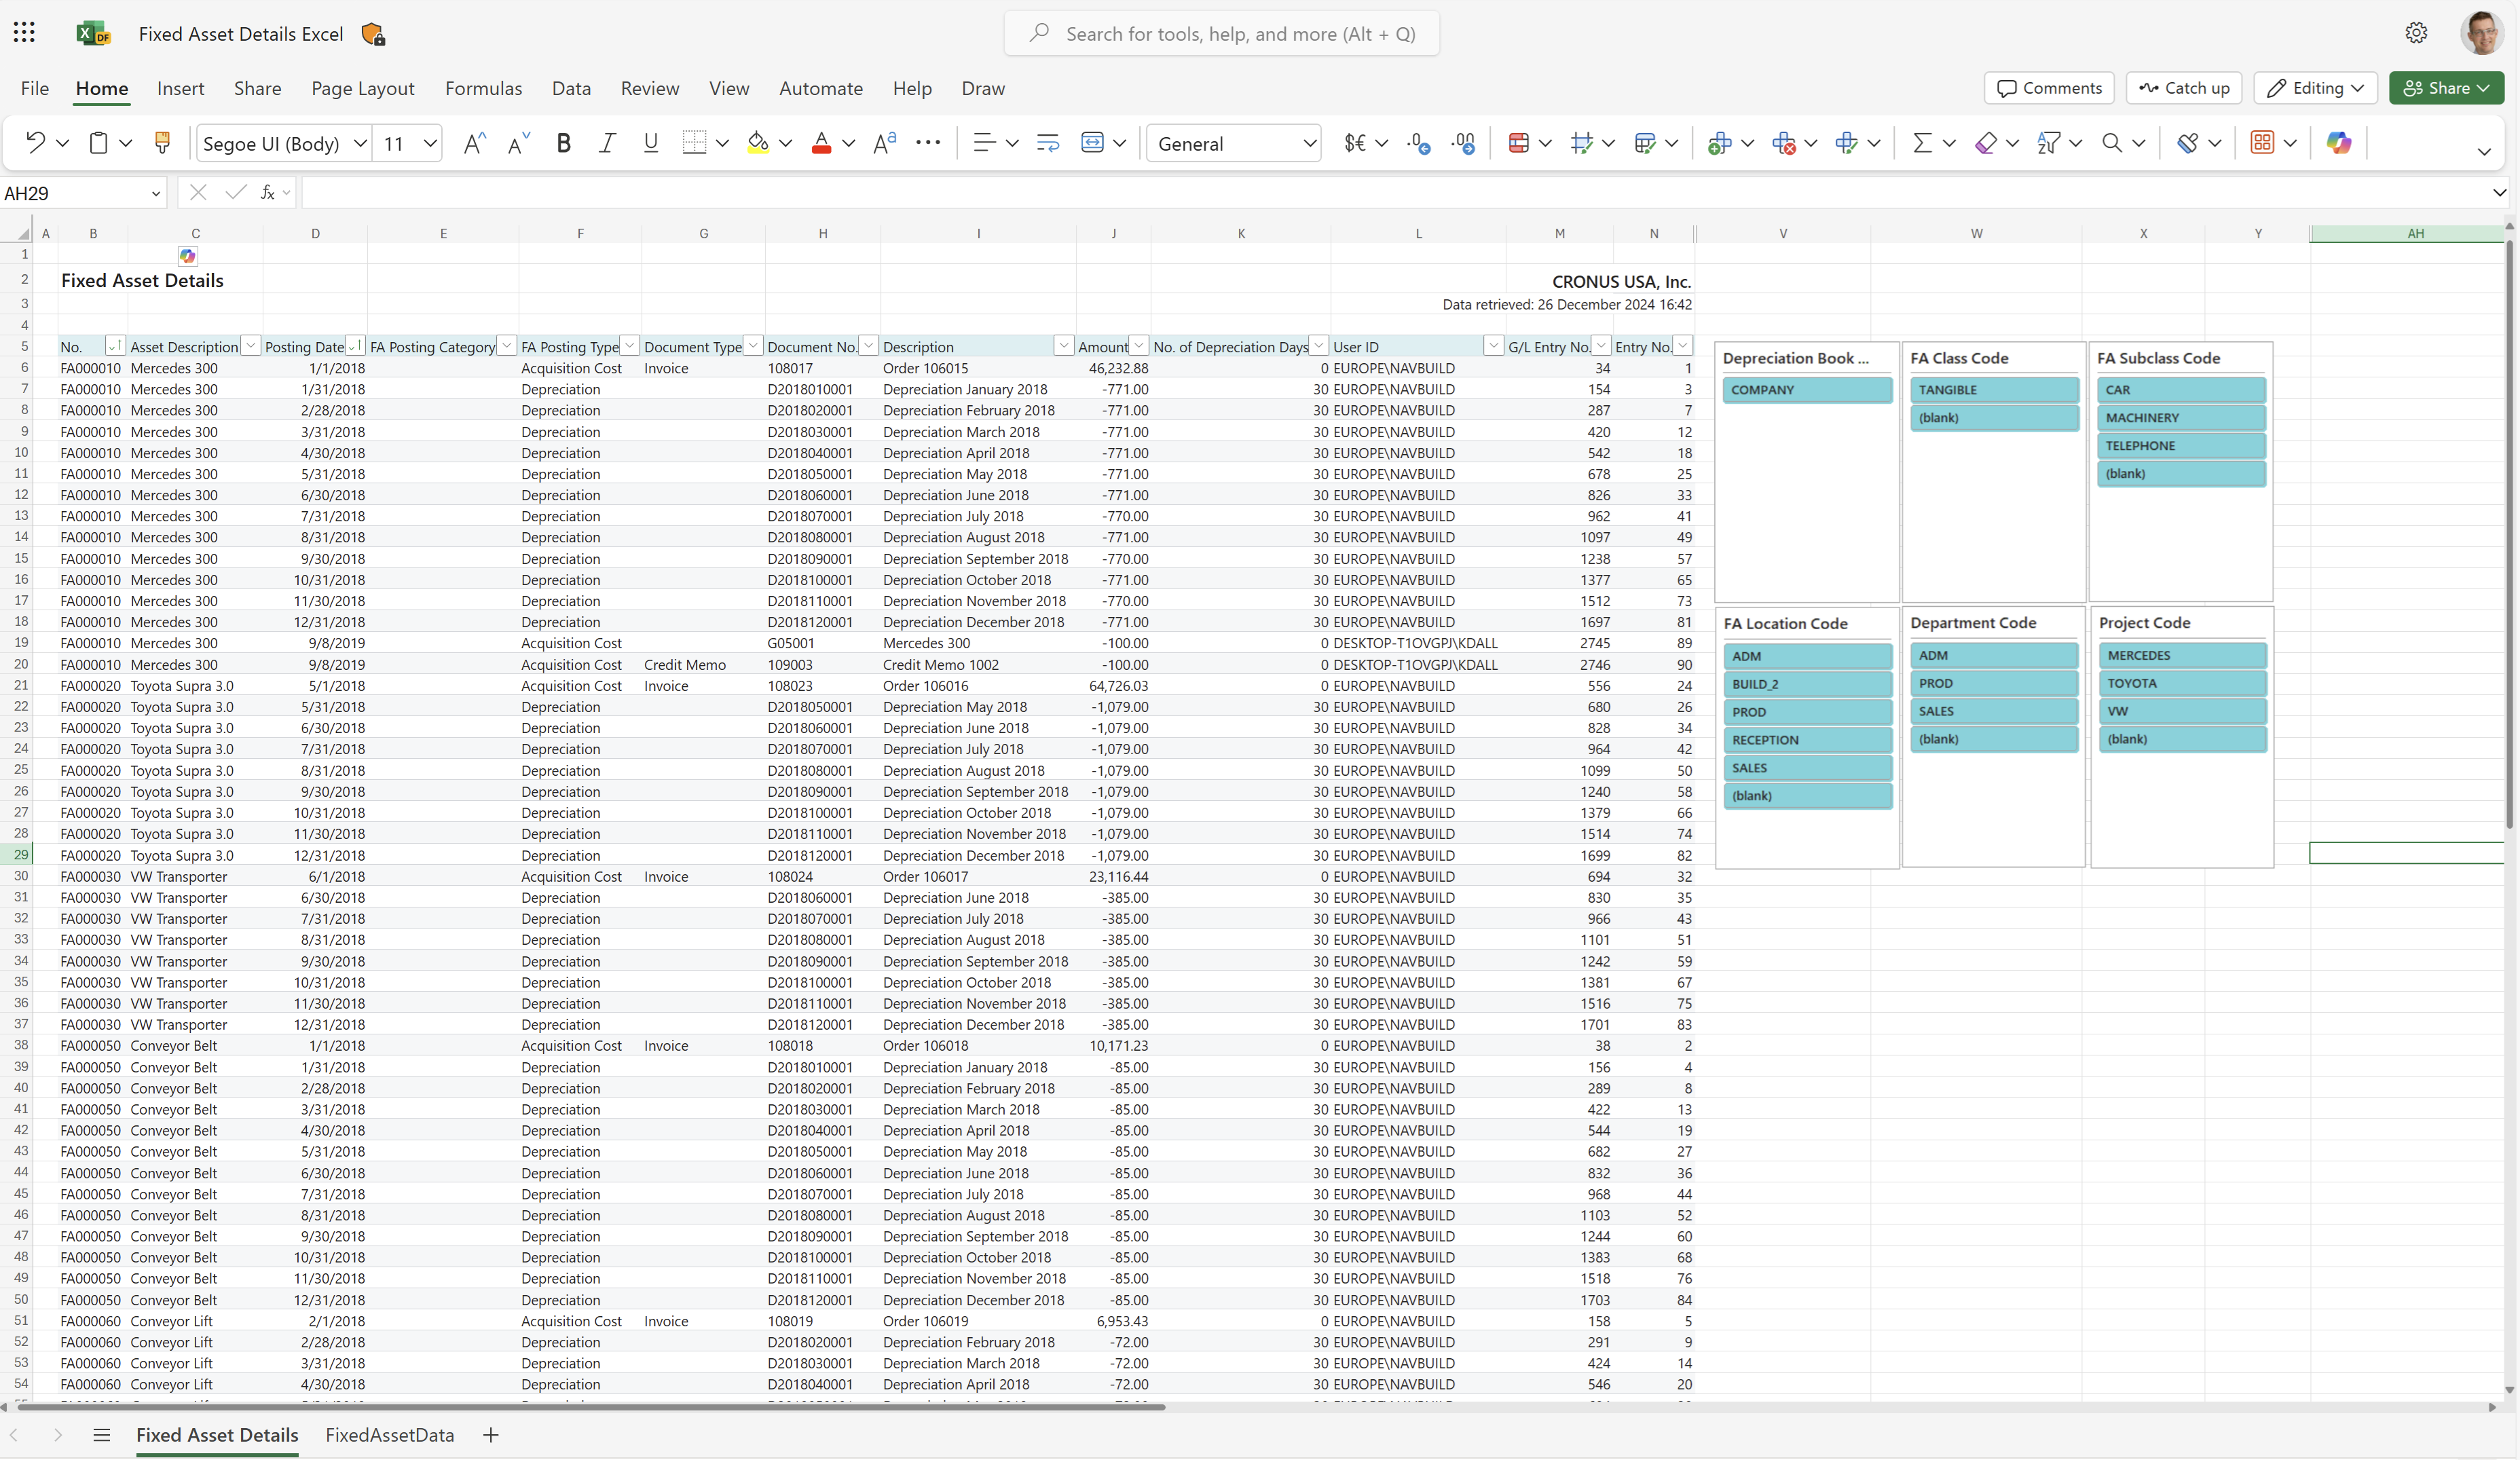
Fixed Asset Details worksheet
This worksheet shows fixed assets ledger entries sorted by fixed asset numbers. It shows data for asset description, posting date, FA posting category, FA posting type, document type, document number, description, amount, number of depreciation days, user ID (who did it), G/L entry number, and entry number.
The filters and slicers on the worksheet let you zoom in on a fixed asset's class, subclass, or location. You can also filter by department code or project code, if needed.
Tip
Tip:
The data is shown in an Excel pivot table. Choose any cell with data to open the Field List, where you can arrange fields, group or ungroup data, and filter data. To learn more, go to the following articles:
FixedAssetData worksheet
This worksheet shows the raw data used in the report.
Use this worksheet for data analysis assisted by built-in tools in Excel, such as Excel Copilot, or the What-if-analysis or Forecast Sheet tools.
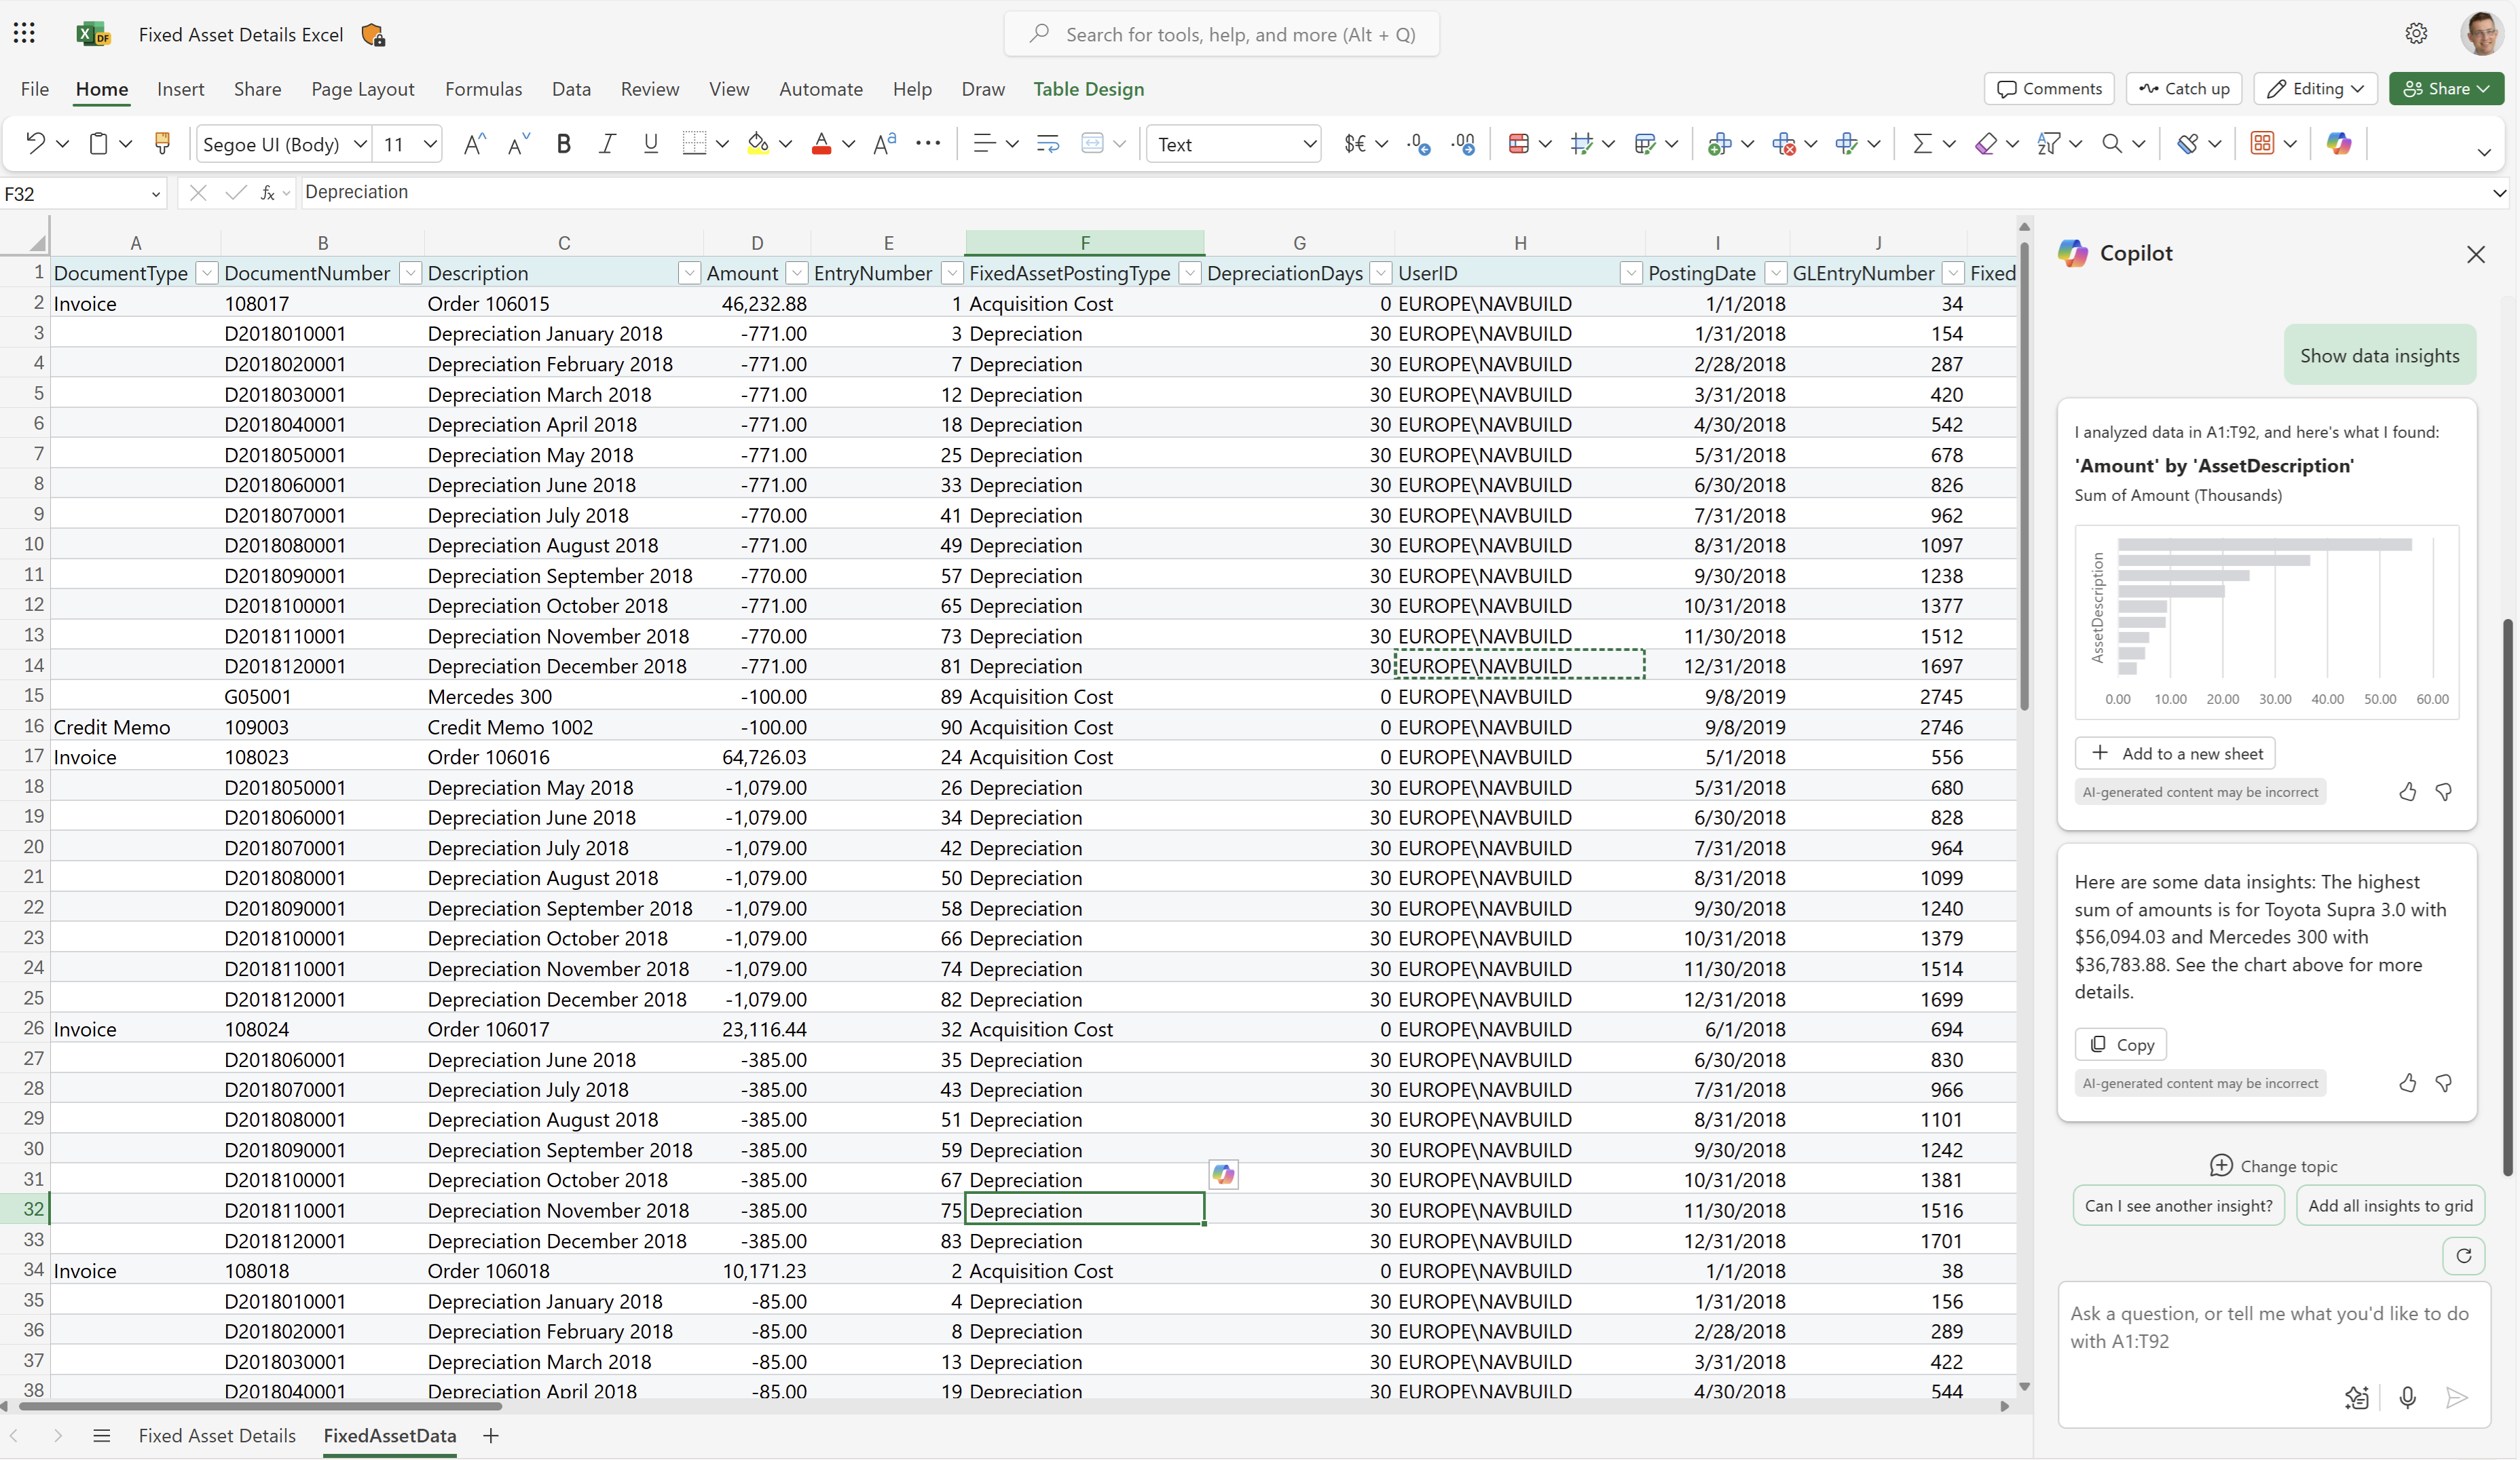
To learn more, go to Get started with Copilot in Excel.
Other worksheets
The Business Central platform always adds three system worksheets to Excel reports:
- TranslationData, with text needed for multi-language reports.
- CaptionData, with text from Business Central fields needed for multi-language reports
- Aggregated Metadata, with data about the report, and when and how it was run.
All three worksheets are hidden by default. To learn more, go to System Excel workbooks in the developer documentation.
Use cases
Get details about fixed assets transactions and reference data that can help you manage your fixed assets.
Fixed asset managers use the report to:
- Track the current status of fixed assets and their location in an organization.
- Plan for the future replacement or upgrade of fixed assets based on their age and condition.
- Calculate the depreciation of fixed assets and ensure that it complies with accounting standards.
Facilities managers use the report to:
- Track the maintenance history and service records for each fixed asset.
- Identify any upcoming maintenance or service needs for fixed assets and plan accordingly.
- Monitor the condition of fixed assets and identify opportunities for repair or replacement.
Financial analysts use the report to:
- Analyze the value of fixed assets over time and identify trends or patterns.
- Calculate the return on investment for fixed assets and assess their overall contribution to the organization's financial performance.
- Identify discrepancies or errors in the fixed asset ledger entries and work with the accounting team to correct them.
Try the report
Try the report here: Fixed Asset Details Excel
Tip
Tip:
If you hold down the CTRL key while you select the report link, the report opens on a new browser tab. In this way, you can stay on the current page while you explore the report on the other browser tab.
Make the report your own
You can create your own report layouts with Excel, either from scratch or based on an existing layout. To modify the layout for the report, export the layout (not the workbook that resulted from running the report) from Business Central, make your changes, and then import the layout into Business Central.
To learn more, go to Task 1: Create the Excel layout file.
Alternative reports
There are several other ways to analyze your fixed assets. To learn more, go to:
Contributors
Microsoft maintains this article. The following contributors provided some or all of its contents.
- Kim Dallefeld | Microsoft MVP
- Steve Chinsky | Microsoft MVP
- Rob Delprado | Microsoft MVP
Related information
Ad-hoc analysis of fixed assets data
Fixed assets analytics overview
Financial analytics overview