Vendor Quality Analysis (Power BI Report)
APPLIES TO: Business Central 2025 release wave 2 and later.
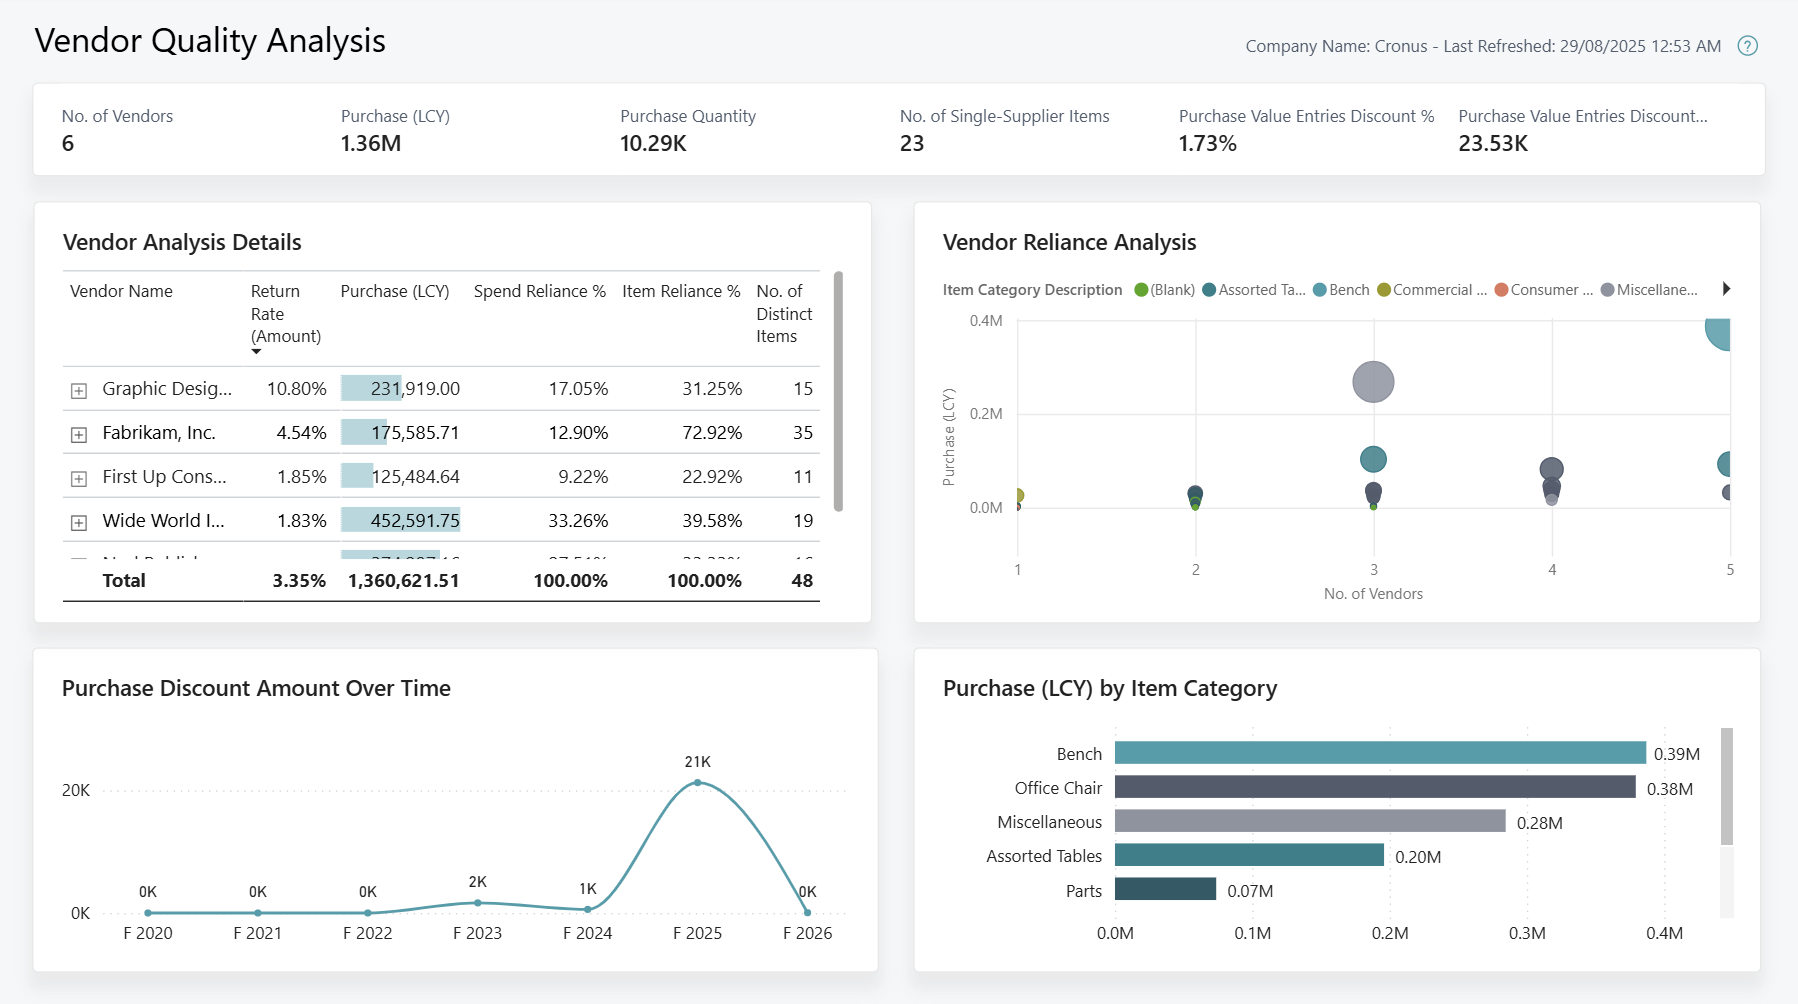
The Vendor Quality Analysis report analyzes vendor performance, showcasing vendor quality, returns, reliance and purchase discount trends. By visualizing key purchasing metrics over time, item distribution and spending diversity, this report provides a breakdown of vendor behaviors to continuously improve supplier performance and mitigate purchasing risks.
Use the report
This report is designed for executives, purchasing managers and purchasers, to highlight effective vendor relationships and minimize supply chain risks.
As a CEO, you want to monitor vendor performance and identify trusted vendors and supplier risks, to inform key business decisions. For example, by reviewing the vendor analysis details, you identify a vendor with the highest Spend Reliance % who consistently performs poorly across returns and discounts. Using these insights, you decide to pursue an alternate supplier to improve supply-chain reliability, product quality and profit metrics.
For purchasing managers, you want to track vendor performance and item dependence, to ensure a reliable supply-chain pipeline. Using the vendor reliance analysis, you identify a single-supplier item with the highest purchase amount. In response, you engage with additional vendors to diversify product supply and reduce over-reliance on a specific vendor.
As a purchaser, you want to analyze vendor behaviors to manage effective supplier relationships. Using the purchase discount amount over time, you might identify a vendor who is not consistently delivering discounts compared to other vendors. With this information, you are empowered to negotiate discounted purchase prices to improve profit metrics.
Key Performance Indicators (KPIs)
The Vendor Quality Analysis report includes the following KPIs and measures:
- Purchase (LCY)
- Purchase Quantity
- No. of Vendors
- No. of Distinct Items
- No. of Single Supplier Items
- Purchase Value Entries Discount %
- Purchase Value Entries Discount Amount
- Return Rate (Amount)
- Spend Reliance %
- Item Reliance %
Click on the link for a KPI to learn more about what it means, how it is calculated, and what data was used in the calculations.
Tip
Tip:
You can easily track the KPIs that the Power BI reports display against your business objectives. To learn more, go to Track your business KPIs with Power BI metrics.
Data used in the report
The report uses data from the following tables in Business Central:
- Value Entries
- Purchase Invoice Lines
- Purchase Credit Lines
- Item
- Vendor
Try the report
Try the report here: Vendor Quality Analysis
Tip
Tip:
If you hold down the CTRL key while you select the report link, the report opens on a new browser tab. In this way, you can stay on the current page while you explore the report on the other browser tab.
Related information
Track KPIs with Power BI metrics
Power BI Purchasing app
Ad hoc analysis of purchasing data
Built-in purchasing reports
Purchasing analytics overview
Purchasing overview