Purchases Return Overview (Power BI Report)
APPLIES TO: Business Central 2025 release wave 2 and later.
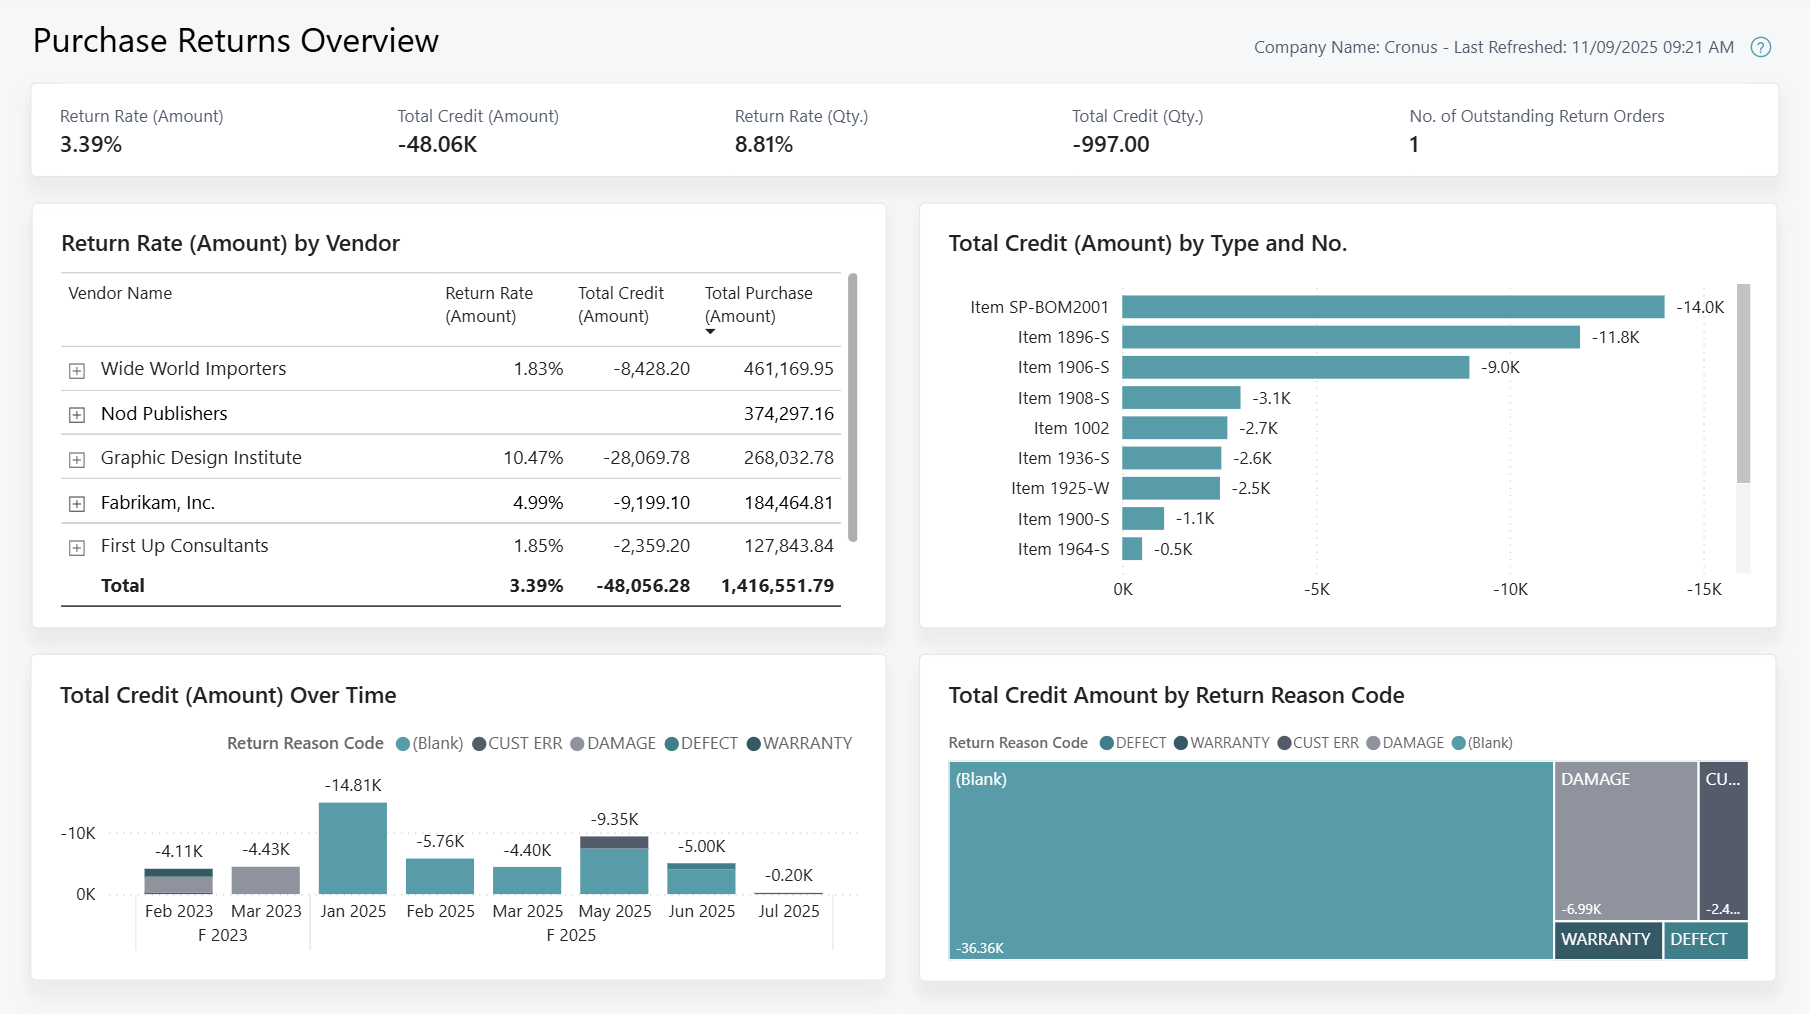
The Purchase Return Overview report tracks and analyzes purchase returns, showing reasons for return, return rate, purchase value and the financial impact on the organization. This report summarizes key return trends by vendor, reason and type, and visualizes return metrics over time.
Use the report
Leadership and purchasing teams use the report to identify the return trends contributing to return orders and credit memos.
For CEOs, you want to evaluate return trends to inform key business decisions. For example, you identify a particular vendor with the highest Return Rate (Amount). In response, you engage with an alternative vendor to minimize returns and reduce time spent conducting product quality inspections.
As a purchasing manager, you want to identify key factors contributing to purchase returns to optimize purchasing operations. For example, you identify an increase in credits attributed to purchaser errors, impacting profit metrics. These insights empower you to invest in additional employee training to improve purchasing processes.
As a purchaser, you want to analyze return trends to ensure product quality while maintaining effective supplier relations. Using this report, you recognize a particular component has an increased credit amount over the past months, due to faulty products. Using this information, you engage with the supplier to switch to a more reliable component, decreasing return frequency.
Key Performance Indicators (KPIs)
The Purchase Return Overview report includes the following KPIs and measures:
- Return Rate (Amount)
- Return Rate (Qty.)
- Total Credit (Amount)
- Total Credit (Qty.)
- Total Purchase (Amount)
- No. of Outstanding Return Orders
Click on the link for a KPI to learn more about what it means, how it is calculated, and what data was used in the calculations.
Tip
Tip:
You can easily track the KPIs that the Power BI reports display against your business objectives. To learn more, go to Track your business KPIs with Power BI metrics.
Data used in the report
The report uses data from the following tables in Business Central:
- Purchase Line
- Value Entry
- Purchase Credit Line
- Purchase Invoice Line
- Reason Code
- Vendor
- Item
- Resource
- G/L Account
Try the report
Try the report here: Purchases return overview
Tip
Tip:
If you hold down the CTRL key while you select the report link, the report opens on a new browser tab. In this way, you can stay on the current page while you explore the report on the other browser tab.
Related information
Track KPIs with Power BI metrics
Power BI Purchasing app
Ad hoc analysis of purchasing data
Built-in purchasing reports
Purchasing analytics overview
Purchasing overview