Project Invoiced Sales by Customer (Power BI Report)
APPLIES TO: Generally available in Business Central 2024 release wave 2.
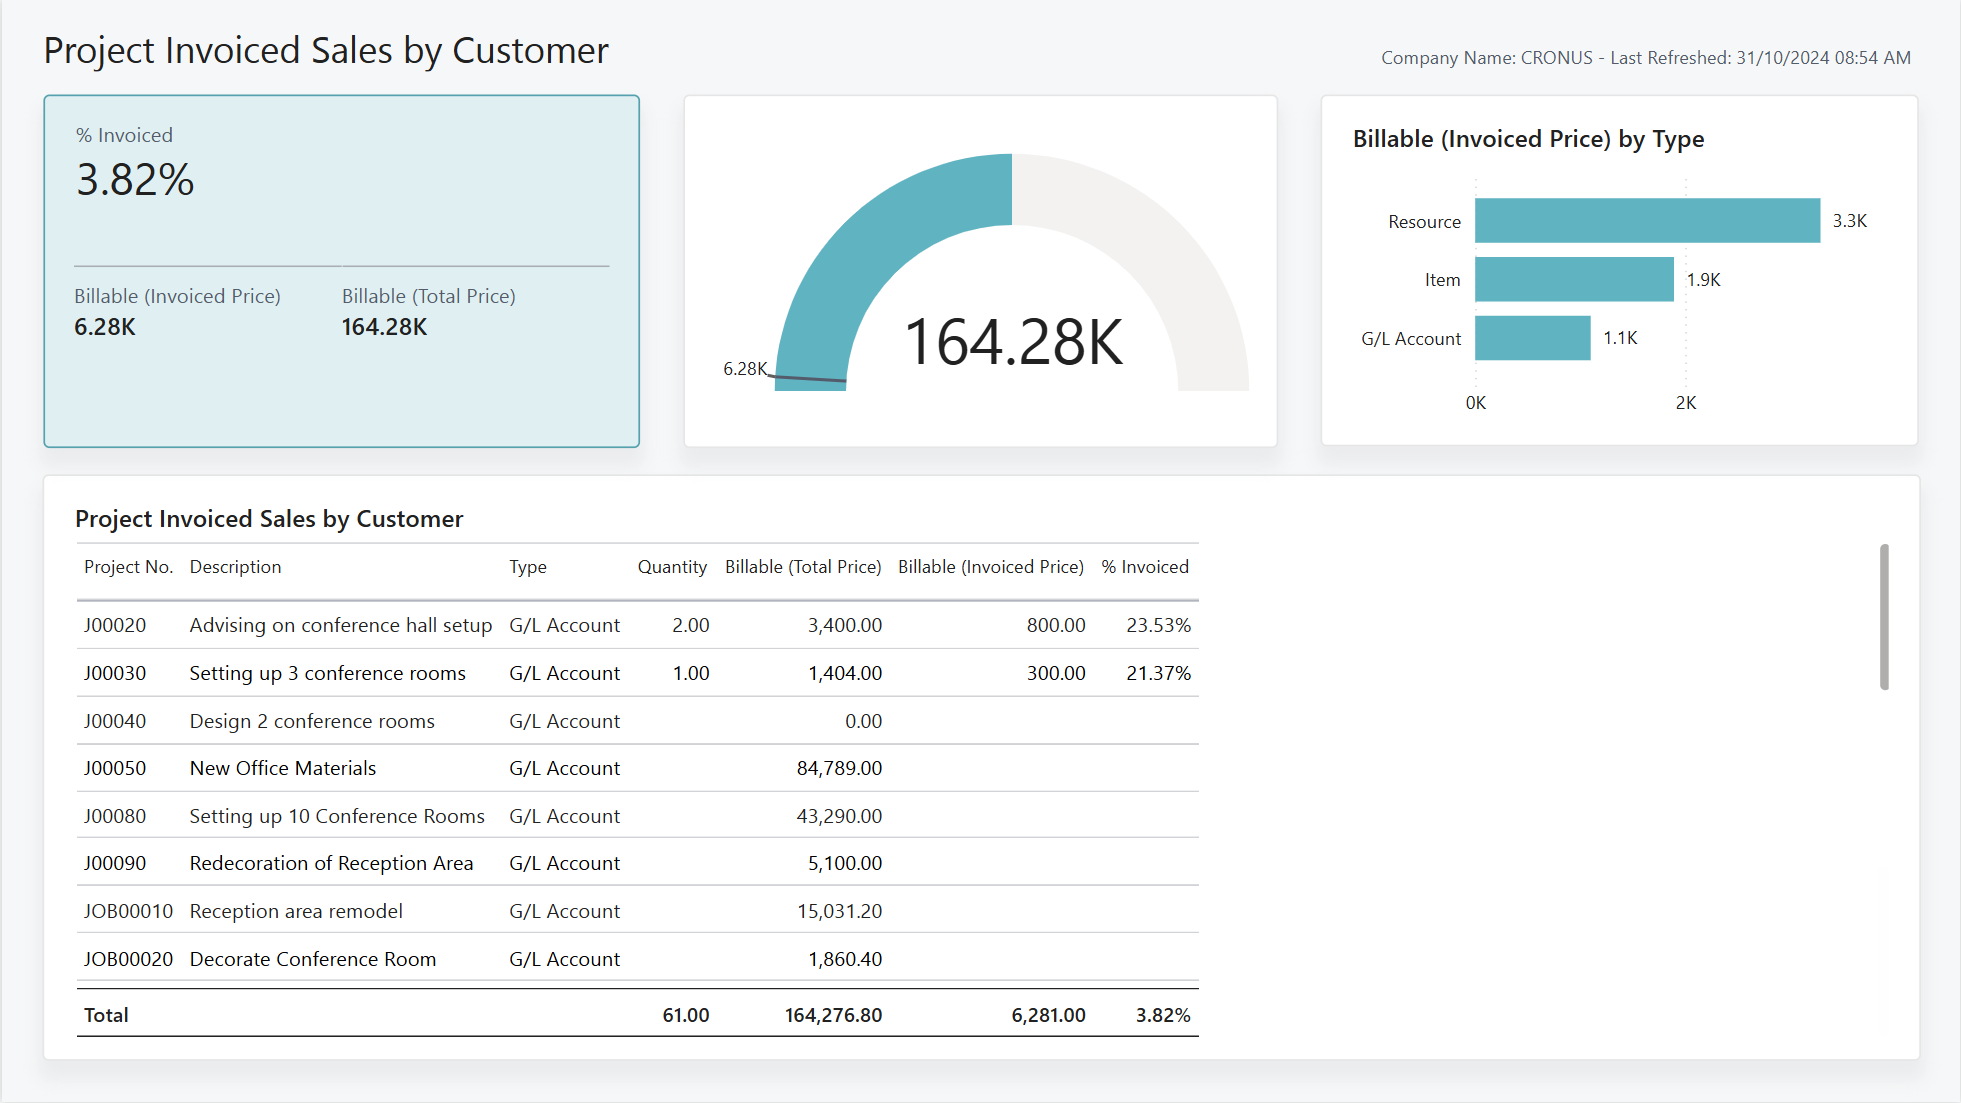
The Project Invoiced Sales by Customer report breaks down your sales values for each project and highlights customer sales.
This report can show you key information about the customers you sell to the most, and which projects generate the sales.
Use the report
The report is typically used by project managers, but leadership can also use it to view your high-volume customers.
Project managers use the report to track sales to each customer for each individual project. The report helps you monitor the performance of each project and identify potential issues if you aren't meeting quota for a customer or you're over spending.
People in leadership teams want to a high-level view of your project sales and which customers you sell to. The report can give you a clear understanding of this data to help you make informed business decisions.
Key Performance Indicators (KPIs)
The Project Invoiced Sales by Customer report includes the following KPIs:
Click on the link for a KPI to learn more about what it means, how it is calculated, and what data was used in the calculations.
Tip
Tip:
You can easily track the KPIs that the Power BI reports display against your business objectives. To learn more, go to Track your business KPIs with Power BI metrics.
Data used in the report
The report uses data from the following tables in Business Central:
- Job
- Job Ledger Entry
- Job Planning Line
Try the report
Try the report here: Project Invoiced Sales by Customer
Tip
Tip:
If you hold down the CTRL key while you select the report link, the report opens on a new browser tab. In this way, you can stay on the current page while you explore the report on the other browser tab.
Related information
Track your business KPIs with Power BI metrics
Power BI Projects app
Built-in Projects reports
Project management analytics overview
Project management overview