Inventory Forecasting (Power BI Report)
APPLIES TO: Business Central 2025 release wave 2 and later.
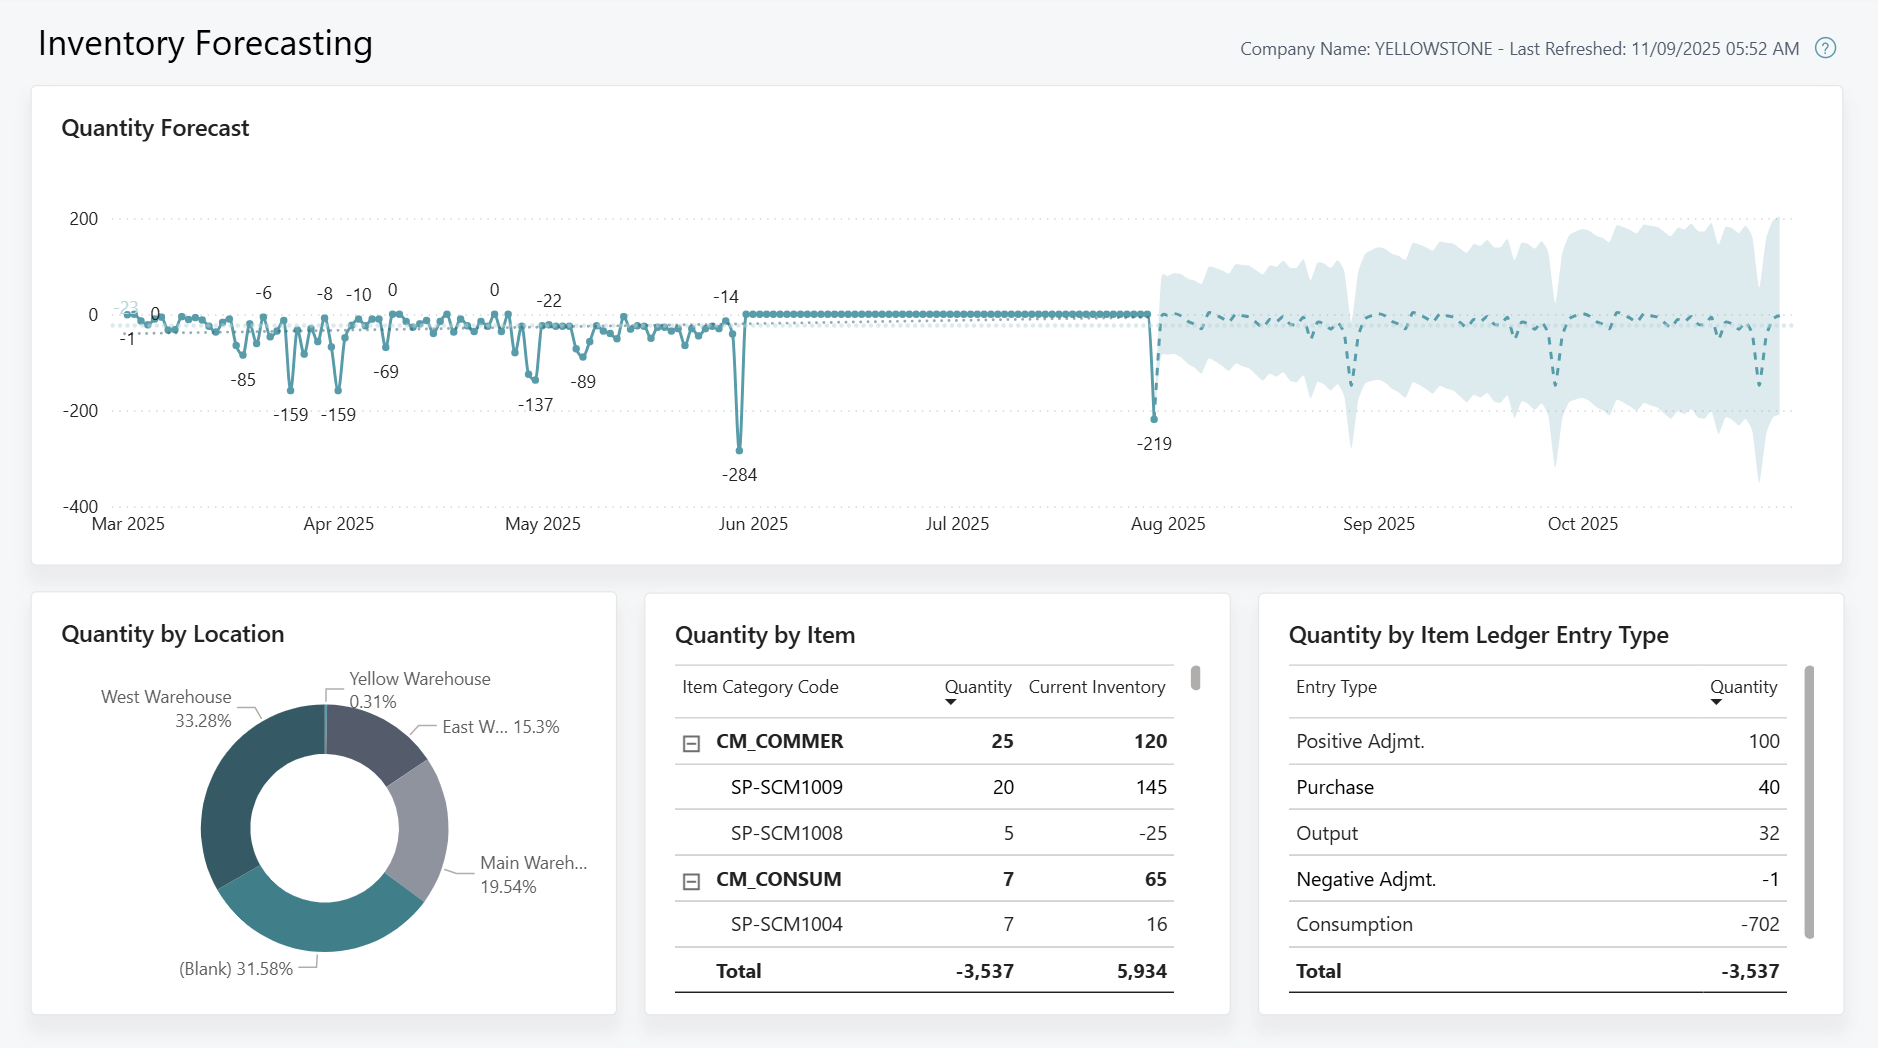
The Inventory Forecasting report predicts future inventory trends based on historical data. It uses advanced techniques to project quantity values across location, item and entry type dimensions, helping users optimize inventory levels.
The inventory forecasting visualization predicts the next three months of quantity based on the previous six months, assuming a monthly seasonality.
Note
Note:
The default forecasting options can be customized through the Forecast section in the Analytics Pane in Power BI Desktop. This includes modifying the forecast length, seasonality, period and confidence interval.
Use the report
The Inventory Forecasting report is designed for inventory managers and procurement officers to track projected stock levels.
As an inventory manager, you can use this report to monitor projected inventory and anticipate significant stock movements. For example, using the quantity by location forecasting, you identify a future period with increased incoming stock. In response, you proactively schedule warehouse employees to ensure adequate staffing to optimize shipping and receiving processes.
As a procurement officer, this report provides key insights into inventory supply and demand, helping users make informed decisions about stock levels and procurement. For example, you recognize a trend of decreased quantity in the same period each month. Using this information, you coordinate replenishment accordingly to ensure stock availability and optimal inventory levels.
Key Performance Indicators (KPIs)
The Inventory Forecasting report includes the following KPIs:
Click on the link for a KPI to learn more about what it means, how it is calculated, and what data was used in the calculations.
Tip
Tip:
You can easily track the KPIs that the Power BI reports display against your business objectives. To learn more, go to Track your business KPIs with Power BI metrics.
Data used in the report
The report uses data from the following tables in Business Central:
- Item Ledger Entries
- Location
- Item
Try the report
Try the report here: Inventory Forecasting
Tip
Tip:
If you hold down the CTRL key while you select the report link, the report opens on a new browser tab. In this way, you can stay on the current page while you explore the report on the other browser tab.
Related information
Track KPIs with Power BI metrics
Power BI Inventory app
Ad hoc analysis of inventory data
Built-in inventory and warehouse reports
Inventory analytics overview
Inventory overview